Immigrants from Thailand vs Laotian Unemployment Among Ages 20 to 24 years
COMPARE
Immigrants from Thailand
Laotian
Unemployment Among Ages 20 to 24 years
Unemployment Among Ages 20 to 24 years Comparison
Immigrants from Thailand
Laotians
9.8%
UNEMPLOYMENT AMONG AGES 20 TO 24 YEARS
99.7/ 100
METRIC RATING
52nd/ 347
METRIC RANK
10.0%
UNEMPLOYMENT AMONG AGES 20 TO 24 YEARS
95.1/ 100
METRIC RATING
101st/ 347
METRIC RANK
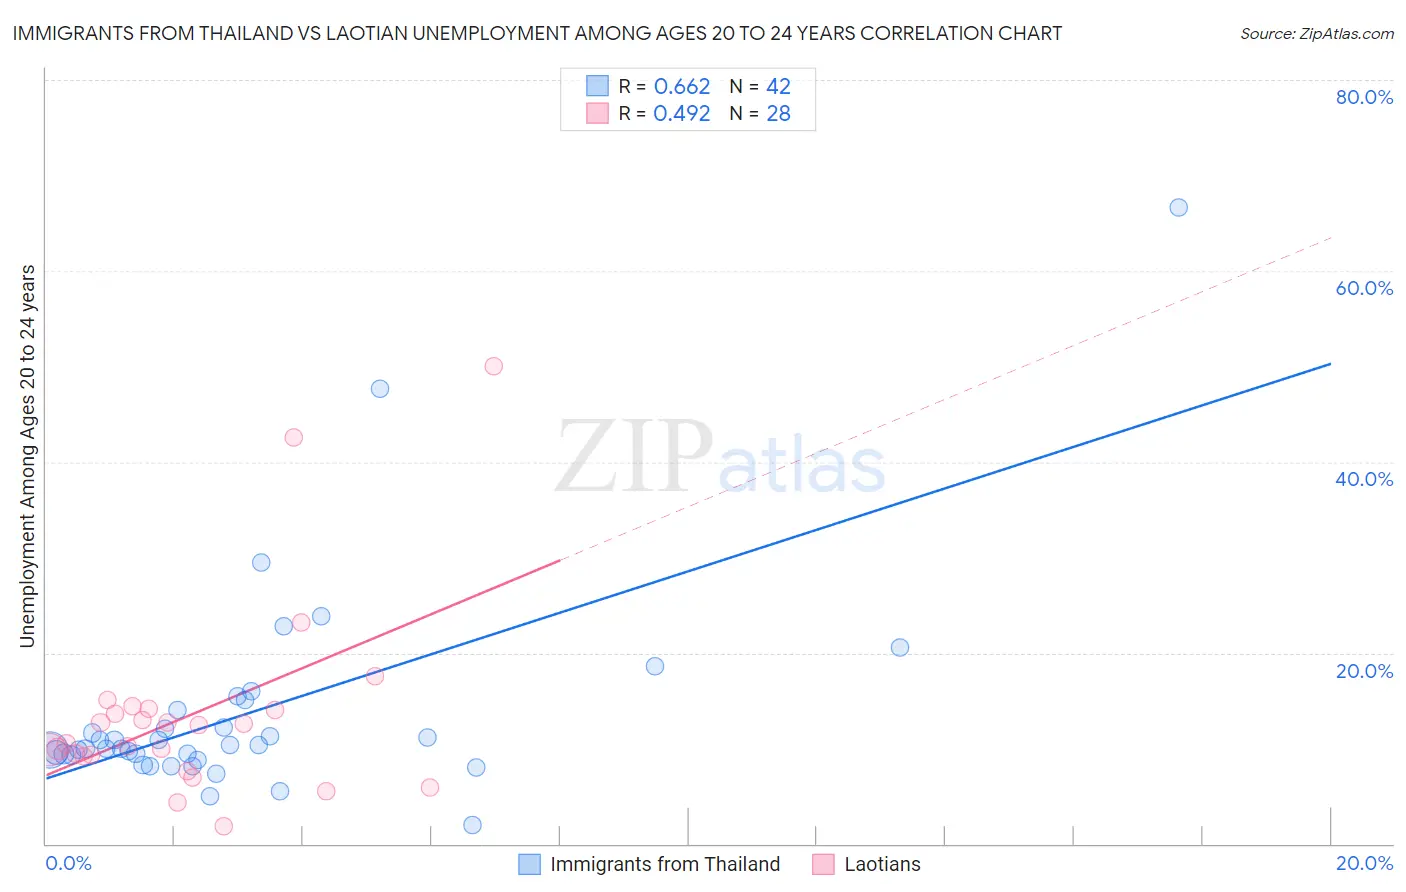
Immigrants from Thailand vs Laotian Unemployment Among Ages 20 to 24 years Correlation Chart
The statistical analysis conducted on geographies consisting of 310,911,339 people shows a significant positive correlation between the proportion of Immigrants from Thailand and unemployment rate among population between the ages 20 and 24 in the United States with a correlation coefficient (R) of 0.662 and weighted average of 9.8%. Similarly, the statistical analysis conducted on geographies consisting of 222,318,463 people shows a moderate positive correlation between the proportion of Laotians and unemployment rate among population between the ages 20 and 24 in the United States with a correlation coefficient (R) of 0.492 and weighted average of 10.0%, a difference of 2.7%.
Unemployment Among Ages 20 to 24 years Correlation Summary
| Measurement | Immigrants from Thailand | Laotian |
| Minimum | 2.0% | 1.8% |
| Maximum | 66.7% | 50.0% |
| Range | 64.7% | 48.2% |
| Mean | 13.7% | 13.5% |
| Median | 10.2% | 11.5% |
| Interquartile 25% (IQ1) | 9.3% | 9.2% |
| Interquartile 75% (IQ3) | 14.0% | 14.1% |
| Interquartile Range (IQR) | 4.6% | 4.8% |
| Standard Deviation (Sample) | 11.3% | 10.2% |
| Standard Deviation (Population) | 11.1% | 10.1% |
Similar Demographics by Unemployment Among Ages 20 to 24 years
Demographics Similar to Immigrants from Thailand by Unemployment Among Ages 20 to 24 years
In terms of unemployment among ages 20 to 24 years, the demographic groups most similar to Immigrants from Thailand are Ethiopian (9.8%, a difference of 0.11%), Immigrants from Serbia (9.8%, a difference of 0.11%), Immigrants from Cambodia (9.8%, a difference of 0.15%), Immigrants from Kenya (9.7%, a difference of 0.17%), and Carpatho Rusyn (9.8%, a difference of 0.28%).
| Demographics | Rating | Rank | Unemployment Among Ages 20 to 24 years |
| Croatians | 99.8 /100 | #45 | Exceptional 9.7% |
| Immigrants | Nicaragua | 99.8 /100 | #46 | Exceptional 9.7% |
| Immigrants | India | 99.8 /100 | #47 | Exceptional 9.7% |
| Finns | 99.8 /100 | #48 | Exceptional 9.7% |
| Creek | 99.8 /100 | #49 | Exceptional 9.7% |
| Immigrants | Kenya | 99.7 /100 | #50 | Exceptional 9.7% |
| Ethiopians | 99.7 /100 | #51 | Exceptional 9.8% |
| Immigrants | Thailand | 99.7 /100 | #52 | Exceptional 9.8% |
| Immigrants | Serbia | 99.6 /100 | #53 | Exceptional 9.8% |
| Immigrants | Cambodia | 99.6 /100 | #54 | Exceptional 9.8% |
| Carpatho Rusyns | 99.6 /100 | #55 | Exceptional 9.8% |
| Nicaraguans | 99.6 /100 | #56 | Exceptional 9.8% |
| Immigrants | Moldova | 99.5 /100 | #57 | Exceptional 9.8% |
| Pakistanis | 99.5 /100 | #58 | Exceptional 9.8% |
| English | 99.5 /100 | #59 | Exceptional 9.8% |
Demographics Similar to Laotians by Unemployment Among Ages 20 to 24 years
In terms of unemployment among ages 20 to 24 years, the demographic groups most similar to Laotians are Immigrants from France (10.0%, a difference of 0.030%), Fijian (10.0%, a difference of 0.040%), Immigrants from Argentina (10.0%, a difference of 0.050%), Japanese (10.0%, a difference of 0.060%), and Irish (10.0%, a difference of 0.16%).
| Demographics | Rating | Rank | Unemployment Among Ages 20 to 24 years |
| Immigrants | Micronesia | 96.6 /100 | #94 | Exceptional 10.0% |
| Scotch-Irish | 96.2 /100 | #95 | Exceptional 10.0% |
| Thais | 96.2 /100 | #96 | Exceptional 10.0% |
| Slavs | 96.1 /100 | #97 | Exceptional 10.0% |
| Japanese | 95.4 /100 | #98 | Exceptional 10.0% |
| Fijians | 95.3 /100 | #99 | Exceptional 10.0% |
| Immigrants | France | 95.2 /100 | #100 | Exceptional 10.0% |
| Laotians | 95.1 /100 | #101 | Exceptional 10.0% |
| Immigrants | Argentina | 94.9 /100 | #102 | Exceptional 10.0% |
| Irish | 94.3 /100 | #103 | Exceptional 10.0% |
| Immigrants | Chile | 94.0 /100 | #104 | Exceptional 10.0% |
| Immigrants | Hungary | 94.0 /100 | #105 | Exceptional 10.0% |
| Pennsylvania Germans | 93.9 /100 | #106 | Exceptional 10.0% |
| Iroquois | 93.4 /100 | #107 | Exceptional 10.1% |
| Immigrants | Latvia | 93.2 /100 | #108 | Exceptional 10.1% |