Immigrants from Canada vs Immigrants from Belize Unemployment Among Ages 20 to 24 years
COMPARE
Immigrants from Canada
Immigrants from Belize
Unemployment Among Ages 20 to 24 years
Unemployment Among Ages 20 to 24 years Comparison
Immigrants from Canada
Immigrants from Belize
10.1%
UNEMPLOYMENT AMONG AGES 20 TO 24 YEARS
88.2/ 100
METRIC RATING
120th/ 347
METRIC RANK
12.0%
UNEMPLOYMENT AMONG AGES 20 TO 24 YEARS
0.0/ 100
METRIC RATING
294th/ 347
METRIC RANK
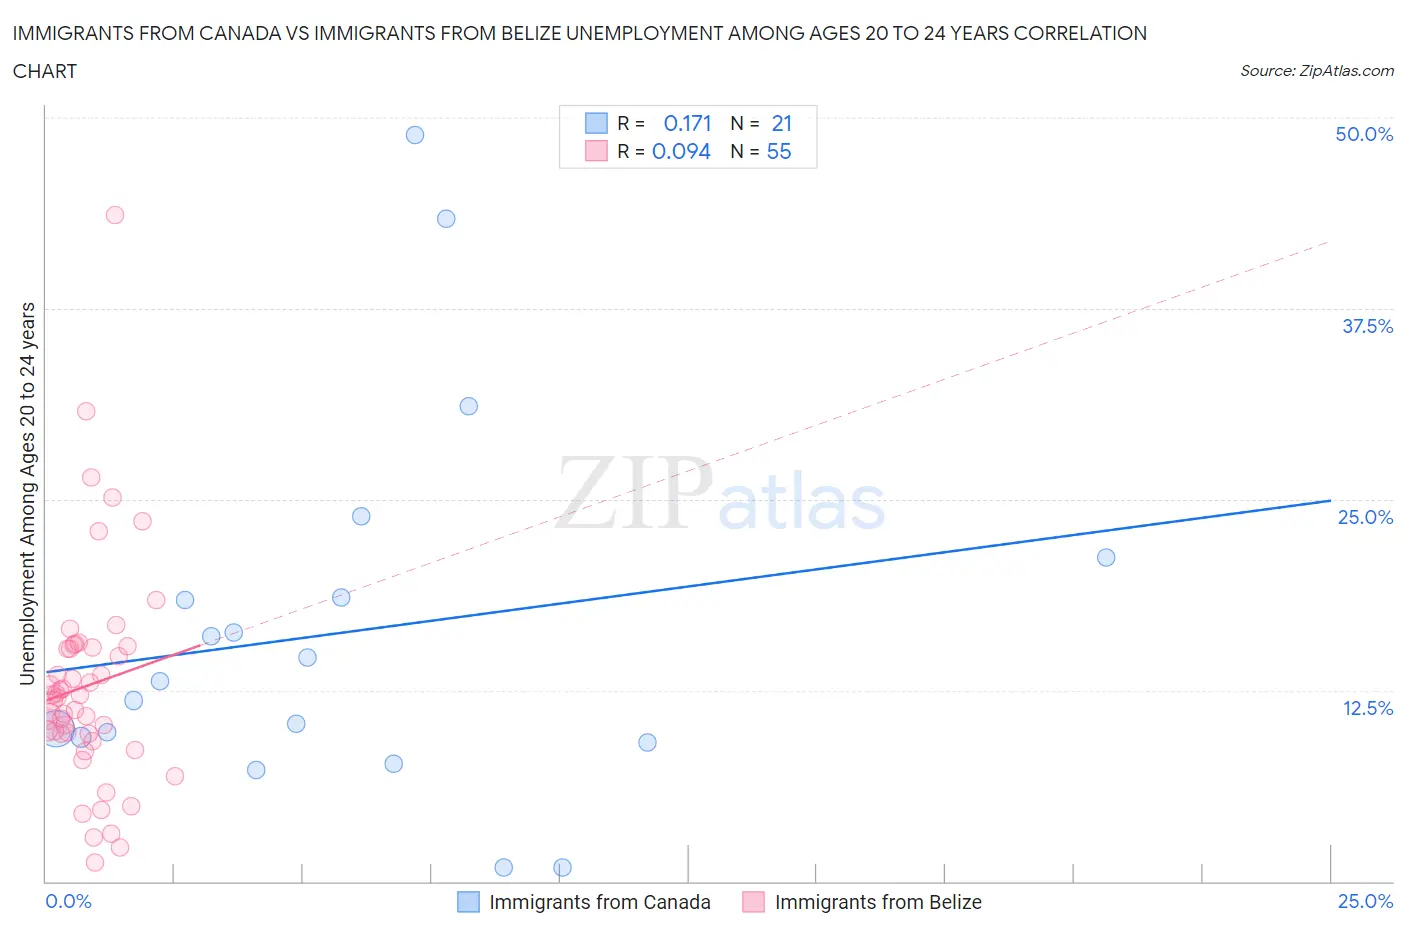
Immigrants from Canada vs Immigrants from Belize Unemployment Among Ages 20 to 24 years Correlation Chart
The statistical analysis conducted on geographies consisting of 438,067,925 people shows a poor positive correlation between the proportion of Immigrants from Canada and unemployment rate among population between the ages 20 and 24 in the United States with a correlation coefficient (R) of 0.171 and weighted average of 10.1%. Similarly, the statistical analysis conducted on geographies consisting of 129,412,636 people shows a slight positive correlation between the proportion of Immigrants from Belize and unemployment rate among population between the ages 20 and 24 in the United States with a correlation coefficient (R) of 0.094 and weighted average of 12.0%, a difference of 18.1%.
Unemployment Among Ages 20 to 24 years Correlation Summary
| Measurement | Immigrants from Canada | Immigrants from Belize |
| Minimum | 0.90% | 1.2% |
| Maximum | 48.8% | 43.6% |
| Range | 47.9% | 42.4% |
| Mean | 16.3% | 12.8% |
| Median | 13.1% | 12.0% |
| Interquartile 25% (IQ1) | 9.3% | 9.6% |
| Interquartile 75% (IQ3) | 19.9% | 15.3% |
| Interquartile Range (IQR) | 10.6% | 5.7% |
| Standard Deviation (Sample) | 12.2% | 7.2% |
| Standard Deviation (Population) | 11.9% | 7.2% |
Similar Demographics by Unemployment Among Ages 20 to 24 years
Demographics Similar to Immigrants from Canada by Unemployment Among Ages 20 to 24 years
In terms of unemployment among ages 20 to 24 years, the demographic groups most similar to Immigrants from Canada are French (10.1%, a difference of 0.0%), South African (10.1%, a difference of 0.030%), Paraguayan (10.1%, a difference of 0.040%), White/Caucasian (10.1%, a difference of 0.070%), and Immigrants from Iraq (10.1%, a difference of 0.10%).
| Demographics | Rating | Rank | Unemployment Among Ages 20 to 24 years |
| German Russians | 92.4 /100 | #113 | Exceptional 10.1% |
| Ottawa | 90.8 /100 | #114 | Exceptional 10.1% |
| Immigrants | Morocco | 90.5 /100 | #115 | Exceptional 10.1% |
| Basques | 89.8 /100 | #116 | Excellent 10.1% |
| Immigrants | Uruguay | 89.6 /100 | #117 | Excellent 10.1% |
| Paraguayans | 88.6 /100 | #118 | Excellent 10.1% |
| French | 88.2 /100 | #119 | Excellent 10.1% |
| Immigrants | Canada | 88.2 /100 | #120 | Excellent 10.1% |
| South Africans | 87.8 /100 | #121 | Excellent 10.1% |
| Whites/Caucasians | 87.4 /100 | #122 | Excellent 10.1% |
| Immigrants | Iraq | 87.1 /100 | #123 | Excellent 10.1% |
| Immigrants | Japan | 86.5 /100 | #124 | Excellent 10.1% |
| Spanish | 86.1 /100 | #125 | Excellent 10.1% |
| Jordanians | 86.1 /100 | #126 | Excellent 10.1% |
| Immigrants | Norway | 85.3 /100 | #127 | Excellent 10.1% |
Demographics Similar to Immigrants from Belize by Unemployment Among Ages 20 to 24 years
In terms of unemployment among ages 20 to 24 years, the demographic groups most similar to Immigrants from Belize are Immigrants from Ghana (11.9%, a difference of 0.030%), Immigrants from Armenia (12.0%, a difference of 0.18%), Cajun (12.0%, a difference of 0.21%), Blackfeet (12.0%, a difference of 0.22%), and Immigrants from Senegal (11.9%, a difference of 0.26%).
| Demographics | Rating | Rank | Unemployment Among Ages 20 to 24 years |
| Immigrants | Ecuador | 0.0 /100 | #287 | Tragic 11.8% |
| U.S. Virgin Islanders | 0.0 /100 | #288 | Tragic 11.8% |
| Belizeans | 0.0 /100 | #289 | Tragic 11.8% |
| Immigrants | Caribbean | 0.0 /100 | #290 | Tragic 11.8% |
| Central American Indians | 0.0 /100 | #291 | Tragic 11.9% |
| Immigrants | Senegal | 0.0 /100 | #292 | Tragic 11.9% |
| Immigrants | Ghana | 0.0 /100 | #293 | Tragic 11.9% |
| Immigrants | Belize | 0.0 /100 | #294 | Tragic 12.0% |
| Immigrants | Armenia | 0.0 /100 | #295 | Tragic 12.0% |
| Cajuns | 0.0 /100 | #296 | Tragic 12.0% |
| Blackfeet | 0.0 /100 | #297 | Tragic 12.0% |
| Lumbee | 0.0 /100 | #298 | Tragic 12.0% |
| Apache | 0.0 /100 | #299 | Tragic 12.0% |
| Spanish American Indians | 0.0 /100 | #300 | Tragic 12.1% |
| Immigrants | Sierra Leone | 0.0 /100 | #301 | Tragic 12.1% |