Belgian vs Immigrants from Kuwait Unemployment Among Ages 35 to 44 years
COMPARE
Belgian
Immigrants from Kuwait
Unemployment Among Ages 35 to 44 years
Unemployment Among Ages 35 to 44 years Comparison
Belgians
Immigrants from Kuwait
4.3%
UNEMPLOYMENT AMONG AGES 35 TO 44 YEARS
98.7/ 100
METRIC RATING
41st/ 347
METRIC RANK
4.3%
UNEMPLOYMENT AMONG AGES 35 TO 44 YEARS
99.5/ 100
METRIC RATING
23rd/ 347
METRIC RANK
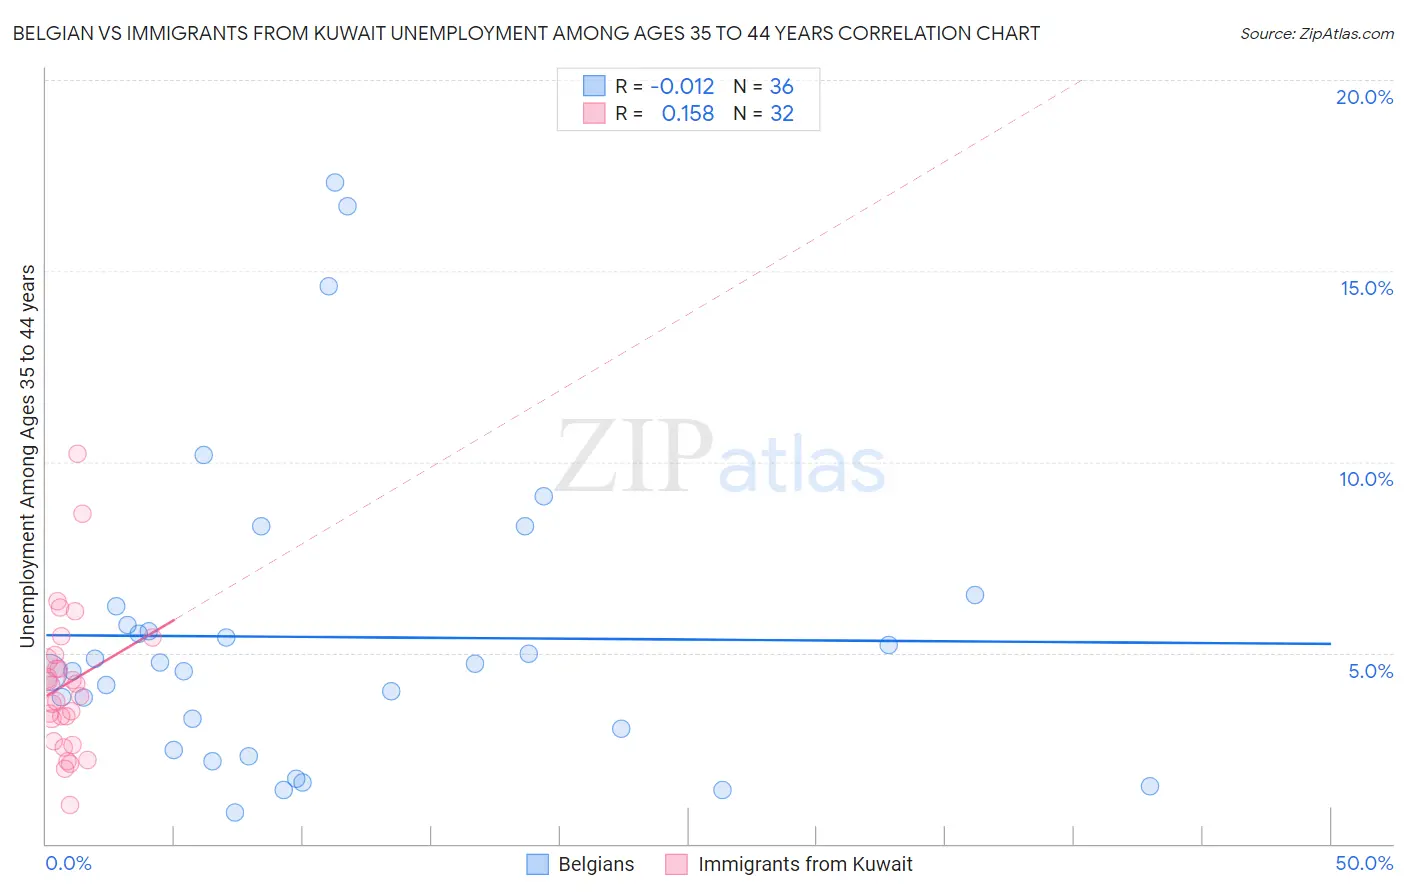
Belgian vs Immigrants from Kuwait Unemployment Among Ages 35 to 44 years Correlation Chart
The statistical analysis conducted on geographies consisting of 346,141,215 people shows no correlation between the proportion of Belgians and unemployment rate among population between the ages 35 and 44 in the United States with a correlation coefficient (R) of -0.012 and weighted average of 4.3%. Similarly, the statistical analysis conducted on geographies consisting of 136,247,564 people shows a poor positive correlation between the proportion of Immigrants from Kuwait and unemployment rate among population between the ages 35 and 44 in the United States with a correlation coefficient (R) of 0.158 and weighted average of 4.3%, a difference of 1.8%.
Unemployment Among Ages 35 to 44 years Correlation Summary
| Measurement | Belgian | Immigrants from Kuwait |
| Minimum | 0.82% | 1.0% |
| Maximum | 17.3% | 10.2% |
| Range | 16.5% | 9.2% |
| Mean | 5.4% | 4.2% |
| Median | 4.6% | 4.0% |
| Interquartile 25% (IQ1) | 2.7% | 3.0% |
| Interquartile 75% (IQ3) | 6.0% | 4.9% |
| Interquartile Range (IQR) | 3.2% | 1.9% |
| Standard Deviation (Sample) | 4.0% | 1.9% |
| Standard Deviation (Population) | 3.9% | 1.9% |
Demographics Similar to Belgians and Immigrants from Kuwait by Unemployment Among Ages 35 to 44 years
In terms of unemployment among ages 35 to 44 years, the demographic groups most similar to Belgians are German (4.3%, a difference of 0.010%), Zimbabwean (4.3%, a difference of 0.10%), Palestinian (4.3%, a difference of 0.16%), Burmese (4.3%, a difference of 0.21%), and Immigrants from Zimbabwe (4.3%, a difference of 0.28%). Similarly, the demographic groups most similar to Immigrants from Kuwait are Tlingit-Haida (4.3%, a difference of 0.010%), Scandinavian (4.2%, a difference of 0.15%), Bulgarian (4.3%, a difference of 0.48%), Turkish (4.3%, a difference of 0.54%), and Assyrian/Chaldean/Syriac (4.3%, a difference of 0.56%).
| Demographics | Rating | Rank | Unemployment Among Ages 35 to 44 years |
| Scandinavians | 99.5 /100 | #22 | Exceptional 4.2% |
| Immigrants | Kuwait | 99.5 /100 | #23 | Exceptional 4.3% |
| Tlingit-Haida | 99.5 /100 | #24 | Exceptional 4.3% |
| Bulgarians | 99.3 /100 | #25 | Exceptional 4.3% |
| Turks | 99.3 /100 | #26 | Exceptional 4.3% |
| Assyrians/Chaldeans/Syriacs | 99.3 /100 | #27 | Exceptional 4.3% |
| Immigrants | Japan | 99.3 /100 | #28 | Exceptional 4.3% |
| Europeans | 99.2 /100 | #29 | Exceptional 4.3% |
| Immigrants | Pakistan | 99.2 /100 | #30 | Exceptional 4.3% |
| Carpatho Rusyns | 99.2 /100 | #31 | Exceptional 4.3% |
| Chinese | 99.1 /100 | #32 | Exceptional 4.3% |
| Immigrants | Sri Lanka | 99.1 /100 | #33 | Exceptional 4.3% |
| Jordanians | 99.0 /100 | #34 | Exceptional 4.3% |
| Luxembourgers | 99.0 /100 | #35 | Exceptional 4.3% |
| Mongolians | 98.9 /100 | #36 | Exceptional 4.3% |
| Immigrants | Zimbabwe | 98.9 /100 | #37 | Exceptional 4.3% |
| Burmese | 98.9 /100 | #38 | Exceptional 4.3% |
| Palestinians | 98.8 /100 | #39 | Exceptional 4.3% |
| Zimbabweans | 98.8 /100 | #40 | Exceptional 4.3% |
| Belgians | 98.7 /100 | #41 | Exceptional 4.3% |
| Germans | 98.7 /100 | #42 | Exceptional 4.3% |