Swiss vs Immigrants from Kuwait Unemployment Among Ages 35 to 44 years
COMPARE
Swiss
Immigrants from Kuwait
Unemployment Among Ages 35 to 44 years
Unemployment Among Ages 35 to 44 years Comparison
Swiss
Immigrants from Kuwait
4.4%
UNEMPLOYMENT AMONG AGES 35 TO 44 YEARS
98.2/ 100
METRIC RATING
49th/ 347
METRIC RANK
4.3%
UNEMPLOYMENT AMONG AGES 35 TO 44 YEARS
99.5/ 100
METRIC RATING
23rd/ 347
METRIC RANK
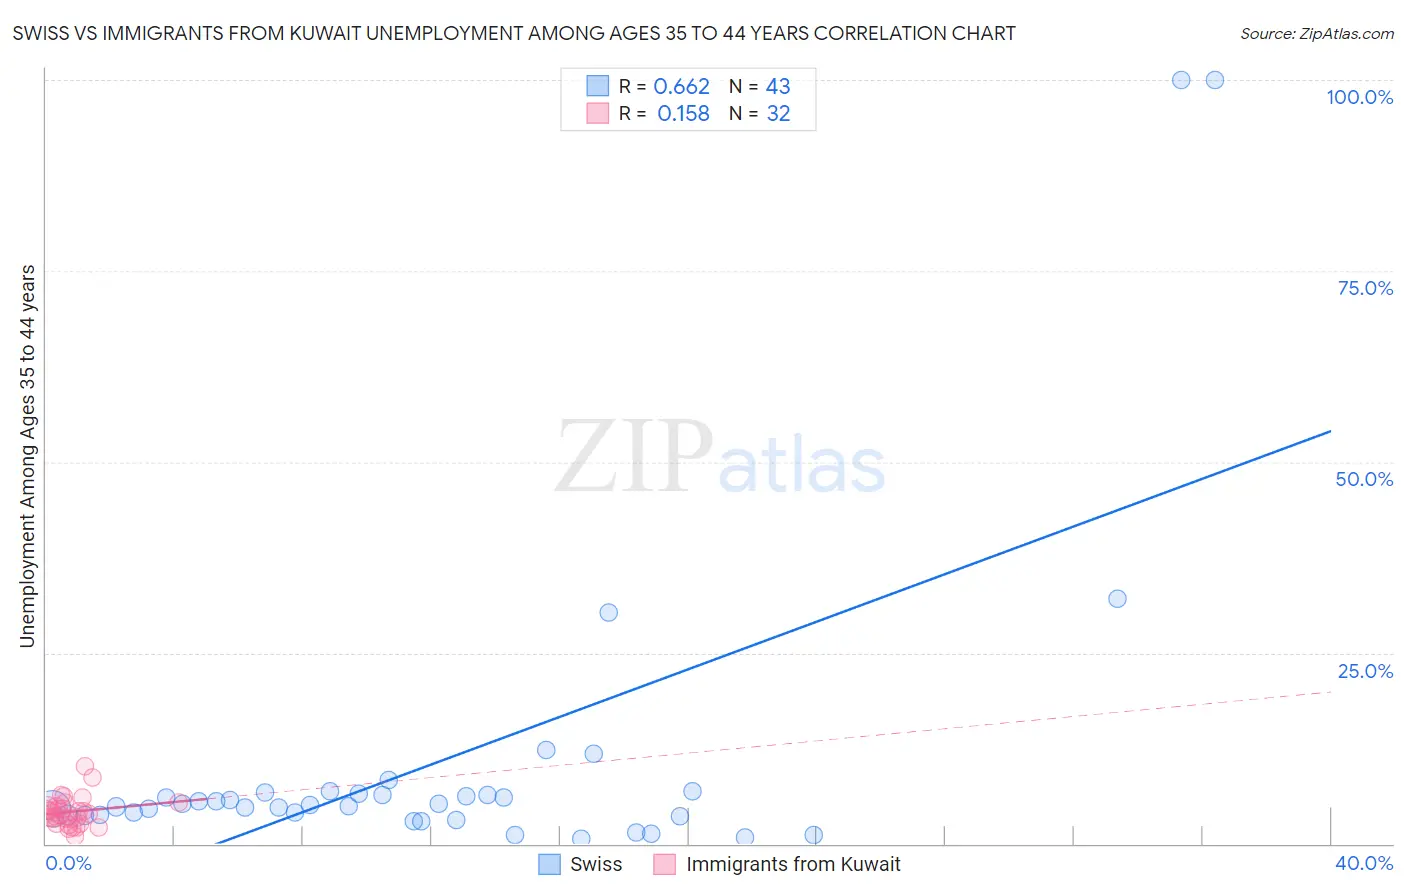
Swiss vs Immigrants from Kuwait Unemployment Among Ages 35 to 44 years Correlation Chart
The statistical analysis conducted on geographies consisting of 444,482,636 people shows a significant positive correlation between the proportion of Swiss and unemployment rate among population between the ages 35 and 44 in the United States with a correlation coefficient (R) of 0.662 and weighted average of 4.4%. Similarly, the statistical analysis conducted on geographies consisting of 136,247,564 people shows a poor positive correlation between the proportion of Immigrants from Kuwait and unemployment rate among population between the ages 35 and 44 in the United States with a correlation coefficient (R) of 0.158 and weighted average of 4.3%, a difference of 2.5%.
Unemployment Among Ages 35 to 44 years Correlation Summary
| Measurement | Swiss | Immigrants from Kuwait |
| Minimum | 0.60% | 1.0% |
| Maximum | 100.0% | 10.2% |
| Range | 99.4% | 9.2% |
| Mean | 10.5% | 4.2% |
| Median | 5.0% | 4.0% |
| Interquartile 25% (IQ1) | 3.7% | 3.0% |
| Interquartile 75% (IQ3) | 6.6% | 4.9% |
| Interquartile Range (IQR) | 2.8% | 1.9% |
| Standard Deviation (Sample) | 20.9% | 1.9% |
| Standard Deviation (Population) | 20.7% | 1.9% |
Similar Demographics by Unemployment Among Ages 35 to 44 years
Demographics Similar to Swiss by Unemployment Among Ages 35 to 44 years
In terms of unemployment among ages 35 to 44 years, the demographic groups most similar to Swiss are Bhutanese (4.4%, a difference of 0.010%), British (4.4%, a difference of 0.090%), Immigrants from Belgium (4.3%, a difference of 0.24%), Immigrants from Korea (4.3%, a difference of 0.25%), and Immigrants from Turkey (4.4%, a difference of 0.40%).
| Demographics | Rating | Rank | Unemployment Among Ages 35 to 44 years |
| Germans | 98.7 /100 | #42 | Exceptional 4.3% |
| Eastern Europeans | 98.7 /100 | #43 | Exceptional 4.3% |
| Immigrants | Malaysia | 98.7 /100 | #44 | Exceptional 4.3% |
| Immigrants | Korea | 98.4 /100 | #45 | Exceptional 4.3% |
| Immigrants | Belgium | 98.4 /100 | #46 | Exceptional 4.3% |
| British | 98.3 /100 | #47 | Exceptional 4.4% |
| Bhutanese | 98.2 /100 | #48 | Exceptional 4.4% |
| Swiss | 98.2 /100 | #49 | Exceptional 4.4% |
| Immigrants | Turkey | 97.8 /100 | #50 | Exceptional 4.4% |
| Immigrants | Eastern Asia | 97.8 /100 | #51 | Exceptional 4.4% |
| Okinawans | 97.7 /100 | #52 | Exceptional 4.4% |
| Immigrants | Argentina | 97.6 /100 | #53 | Exceptional 4.4% |
| Asians | 97.4 /100 | #54 | Exceptional 4.4% |
| Immigrants | Moldova | 97.3 /100 | #55 | Exceptional 4.4% |
| Chileans | 97.3 /100 | #56 | Exceptional 4.4% |
Demographics Similar to Immigrants from Kuwait by Unemployment Among Ages 35 to 44 years
In terms of unemployment among ages 35 to 44 years, the demographic groups most similar to Immigrants from Kuwait are Tlingit-Haida (4.3%, a difference of 0.010%), Scandinavian (4.2%, a difference of 0.15%), Paraguayan (4.2%, a difference of 0.41%), Bulgarian (4.3%, a difference of 0.48%), and Turkish (4.3%, a difference of 0.54%).
| Demographics | Rating | Rank | Unemployment Among Ages 35 to 44 years |
| Cubans | 99.8 /100 | #16 | Exceptional 4.2% |
| Swedes | 99.8 /100 | #17 | Exceptional 4.2% |
| Latvians | 99.8 /100 | #18 | Exceptional 4.2% |
| Immigrants | Nepal | 99.7 /100 | #19 | Exceptional 4.2% |
| Immigrants | Bolivia | 99.7 /100 | #20 | Exceptional 4.2% |
| Paraguayans | 99.6 /100 | #21 | Exceptional 4.2% |
| Scandinavians | 99.5 /100 | #22 | Exceptional 4.2% |
| Immigrants | Kuwait | 99.5 /100 | #23 | Exceptional 4.3% |
| Tlingit-Haida | 99.5 /100 | #24 | Exceptional 4.3% |
| Bulgarians | 99.3 /100 | #25 | Exceptional 4.3% |
| Turks | 99.3 /100 | #26 | Exceptional 4.3% |
| Assyrians/Chaldeans/Syriacs | 99.3 /100 | #27 | Exceptional 4.3% |
| Immigrants | Japan | 99.3 /100 | #28 | Exceptional 4.3% |
| Europeans | 99.2 /100 | #29 | Exceptional 4.3% |
| Immigrants | Pakistan | 99.2 /100 | #30 | Exceptional 4.3% |