Immigrants from Dominican Republic vs Immigrants from Eastern Africa Unemployment Among Women with Children Under 6 years
COMPARE
Immigrants from Dominican Republic
Immigrants from Eastern Africa
Unemployment Among Women with Children Under 6 years
Unemployment Among Women with Children Under 6 years Comparison
Immigrants from Dominican Republic
Immigrants from Eastern Africa
8.9%
UNEMPLOYMENT AMONG WOMEN WITH CHILDREN UNDER 6 YEARS
0.0/ 100
METRIC RATING
296th/ 347
METRIC RANK
7.2%
UNEMPLOYMENT AMONG WOMEN WITH CHILDREN UNDER 6 YEARS
97.7/ 100
METRIC RATING
96th/ 347
METRIC RANK
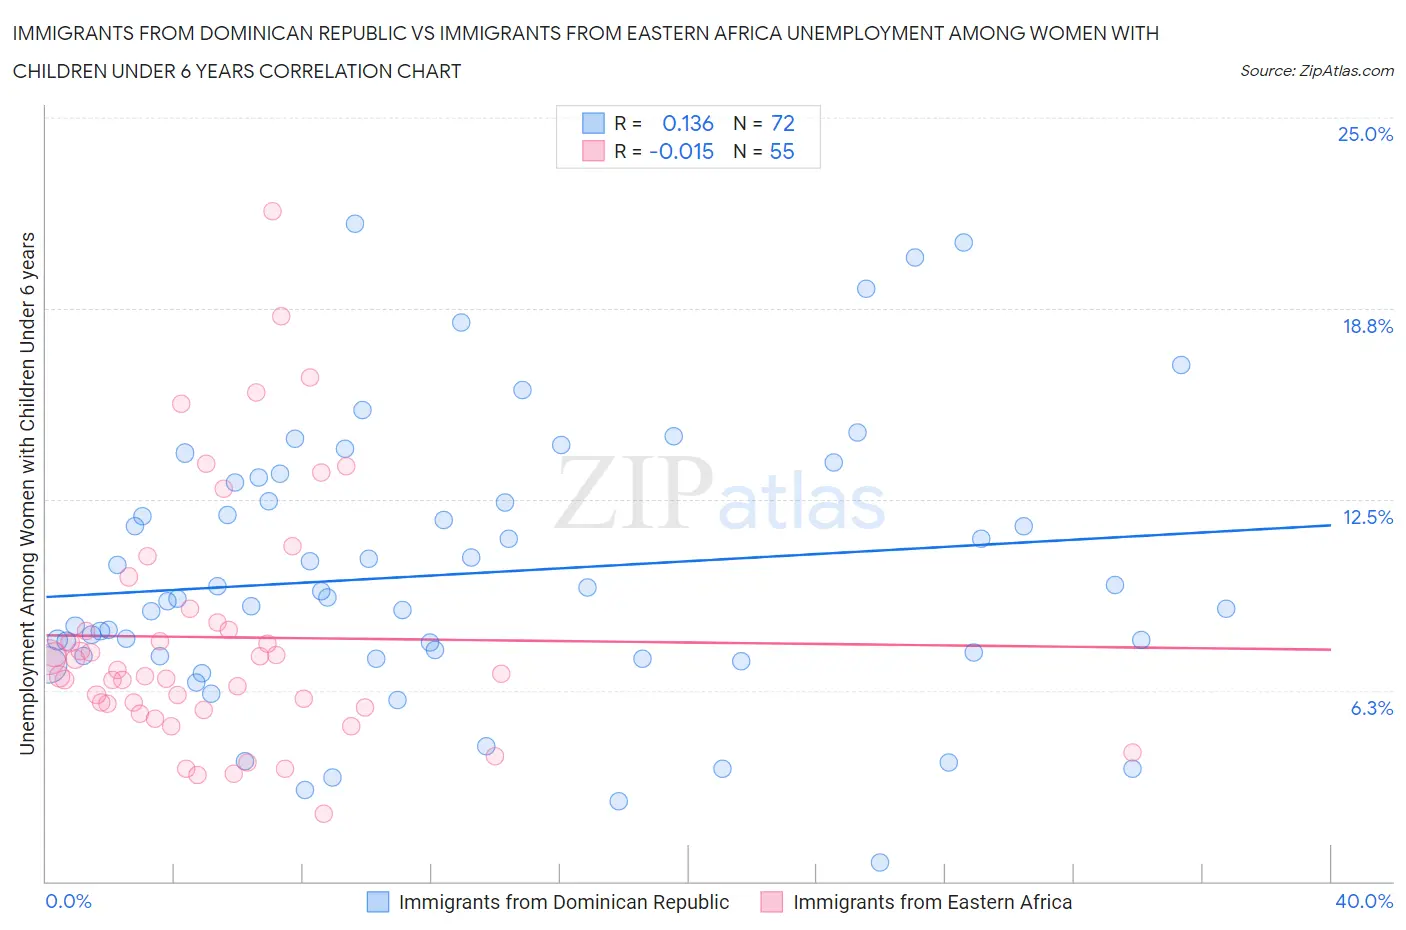
Immigrants from Dominican Republic vs Immigrants from Eastern Africa Unemployment Among Women with Children Under 6 years Correlation Chart
The statistical analysis conducted on geographies consisting of 221,187,094 people shows a poor positive correlation between the proportion of Immigrants from Dominican Republic and unemployment rate among women with children under the age of 6 in the United States with a correlation coefficient (R) of 0.136 and weighted average of 8.9%. Similarly, the statistical analysis conducted on geographies consisting of 280,421,039 people shows no correlation between the proportion of Immigrants from Eastern Africa and unemployment rate among women with children under the age of 6 in the United States with a correlation coefficient (R) of -0.015 and weighted average of 7.2%, a difference of 23.6%.
Unemployment Among Women with Children Under 6 years Correlation Summary
| Measurement | Immigrants from Dominican Republic | Immigrants from Eastern Africa |
| Minimum | 0.60% | 2.2% |
| Maximum | 21.5% | 22.0% |
| Range | 20.9% | 19.8% |
| Mean | 10.1% | 8.0% |
| Median | 9.3% | 6.8% |
| Interquartile 25% (IQ1) | 7.4% | 5.7% |
| Interquartile 75% (IQ3) | 12.8% | 8.5% |
| Interquartile Range (IQR) | 5.4% | 2.8% |
| Standard Deviation (Sample) | 4.4% | 4.0% |
| Standard Deviation (Population) | 4.4% | 4.0% |
Similar Demographics by Unemployment Among Women with Children Under 6 years
Demographics Similar to Immigrants from Dominican Republic by Unemployment Among Women with Children Under 6 years
In terms of unemployment among women with children under 6 years, the demographic groups most similar to Immigrants from Dominican Republic are Mexican (8.9%, a difference of 0.10%), Immigrants from Central America (8.9%, a difference of 0.13%), Nonimmigrants (8.8%, a difference of 0.18%), Tlingit-Haida (8.9%, a difference of 0.25%), and Immigrants from Bangladesh (8.8%, a difference of 0.36%).
| Demographics | Rating | Rank | Unemployment Among Women with Children Under 6 years |
| Iroquois | 0.0 /100 | #289 | Tragic 8.7% |
| Vietnamese | 0.0 /100 | #290 | Tragic 8.8% |
| Jamaicans | 0.0 /100 | #291 | Tragic 8.8% |
| Cheyenne | 0.0 /100 | #292 | Tragic 8.8% |
| Immigrants | Bangladesh | 0.0 /100 | #293 | Tragic 8.8% |
| Immigrants | Nonimmigrants | 0.0 /100 | #294 | Tragic 8.8% |
| Immigrants | Central America | 0.0 /100 | #295 | Tragic 8.9% |
| Immigrants | Dominican Republic | 0.0 /100 | #296 | Tragic 8.9% |
| Mexicans | 0.0 /100 | #297 | Tragic 8.9% |
| Tlingit-Haida | 0.0 /100 | #298 | Tragic 8.9% |
| Immigrants | Jamaica | 0.0 /100 | #299 | Tragic 8.9% |
| Creek | 0.0 /100 | #300 | Tragic 8.9% |
| Chickasaw | 0.0 /100 | #301 | Tragic 9.0% |
| Hispanics or Latinos | 0.0 /100 | #302 | Tragic 9.0% |
| Immigrants | West Indies | 0.0 /100 | #303 | Tragic 9.0% |
Demographics Similar to Immigrants from Eastern Africa by Unemployment Among Women with Children Under 6 years
In terms of unemployment among women with children under 6 years, the demographic groups most similar to Immigrants from Eastern Africa are Romanian (7.2%, a difference of 0.010%), Macedonian (7.2%, a difference of 0.060%), Immigrants from South Eastern Asia (7.2%, a difference of 0.080%), Russian (7.2%, a difference of 0.11%), and New Zealander (7.2%, a difference of 0.13%).
| Demographics | Rating | Rank | Unemployment Among Women with Children Under 6 years |
| Immigrants | Denmark | 98.3 /100 | #89 | Exceptional 7.1% |
| Immigrants | Spain | 98.2 /100 | #90 | Exceptional 7.1% |
| Danes | 98.2 /100 | #91 | Exceptional 7.1% |
| Albanians | 98.0 /100 | #92 | Exceptional 7.2% |
| New Zealanders | 97.8 /100 | #93 | Exceptional 7.2% |
| Macedonians | 97.7 /100 | #94 | Exceptional 7.2% |
| Romanians | 97.7 /100 | #95 | Exceptional 7.2% |
| Immigrants | Eastern Africa | 97.7 /100 | #96 | Exceptional 7.2% |
| Immigrants | South Eastern Asia | 97.6 /100 | #97 | Exceptional 7.2% |
| Russians | 97.5 /100 | #98 | Exceptional 7.2% |
| Immigrants | Europe | 97.5 /100 | #99 | Exceptional 7.2% |
| Immigrants | Northern Europe | 97.4 /100 | #100 | Exceptional 7.2% |
| Chileans | 97.4 /100 | #101 | Exceptional 7.2% |
| Immigrants | Nicaragua | 97.3 /100 | #102 | Exceptional 7.2% |
| Immigrants | Saudi Arabia | 97.3 /100 | #103 | Exceptional 7.2% |