Central American Indian vs Immigrants from Colombia Unemployment Among Ages 65 to 74 years
COMPARE
Central American Indian
Immigrants from Colombia
Unemployment Among Ages 65 to 74 years
Unemployment Among Ages 65 to 74 years Comparison
Central American Indians
Immigrants from Colombia
5.7%
UNEMPLOYMENT AMONG AGES 65 TO 74 YEARS
0.0/ 100
METRIC RATING
287th/ 347
METRIC RANK
5.7%
UNEMPLOYMENT AMONG AGES 65 TO 74 YEARS
0.1/ 100
METRIC RATING
269th/ 347
METRIC RANK
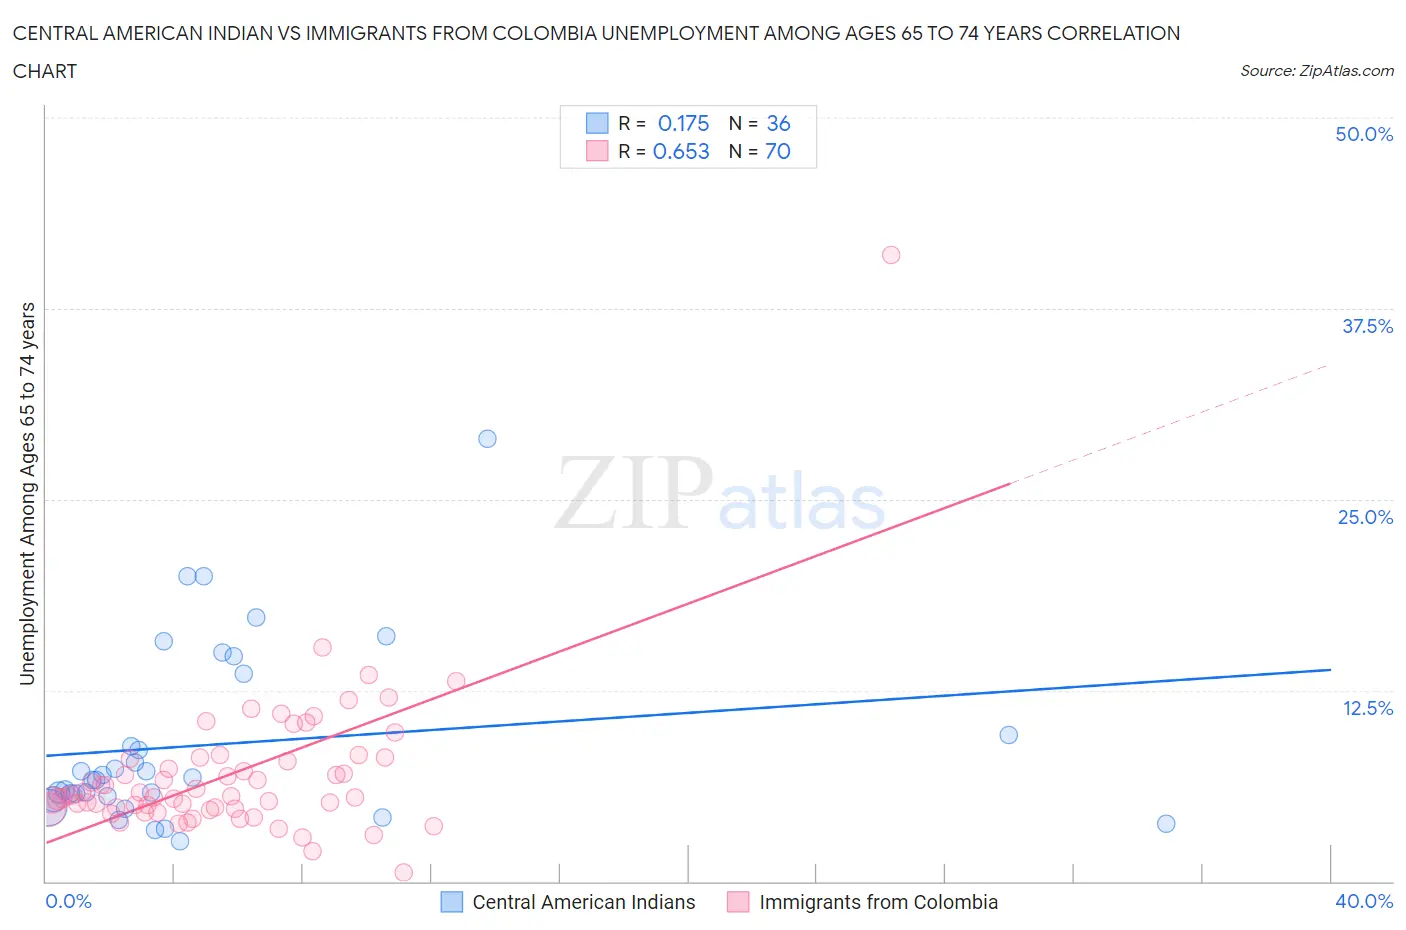
Central American Indian vs Immigrants from Colombia Unemployment Among Ages 65 to 74 years Correlation Chart
The statistical analysis conducted on geographies consisting of 295,430,986 people shows a poor positive correlation between the proportion of Central American Indians and unemployment rate among population between the ages 65 and 74 in the United States with a correlation coefficient (R) of 0.175 and weighted average of 5.7%. Similarly, the statistical analysis conducted on geographies consisting of 338,054,875 people shows a significant positive correlation between the proportion of Immigrants from Colombia and unemployment rate among population between the ages 65 and 74 in the United States with a correlation coefficient (R) of 0.653 and weighted average of 5.7%, a difference of 0.88%.
Unemployment Among Ages 65 to 74 years Correlation Summary
| Measurement | Central American Indian | Immigrants from Colombia |
| Minimum | 2.6% | 0.60% |
| Maximum | 29.0% | 41.0% |
| Range | 26.4% | 40.4% |
| Mean | 8.9% | 7.0% |
| Median | 6.7% | 5.6% |
| Interquartile 25% (IQ1) | 5.5% | 4.8% |
| Interquartile 75% (IQ3) | 11.6% | 8.0% |
| Interquartile Range (IQR) | 6.1% | 3.2% |
| Standard Deviation (Sample) | 5.9% | 5.0% |
| Standard Deviation (Population) | 5.8% | 5.0% |
Demographics Similar to Central American Indians and Immigrants from Colombia by Unemployment Among Ages 65 to 74 years
In terms of unemployment among ages 65 to 74 years, the demographic groups most similar to Central American Indians are Marshallese (5.7%, a difference of 0.080%), Immigrants from Sierra Leone (5.7%, a difference of 0.11%), Chippewa (5.7%, a difference of 0.16%), Cypriot (5.7%, a difference of 0.17%), and Ottawa (5.7%, a difference of 0.20%). Similarly, the demographic groups most similar to Immigrants from Colombia are Immigrants from Nigeria (5.7%, a difference of 0.030%), Belizean (5.7%, a difference of 0.050%), Yaqui (5.7%, a difference of 0.070%), Hawaiian (5.7%, a difference of 0.080%), and Bahamian (5.7%, a difference of 0.090%).
| Demographics | Rating | Rank | Unemployment Among Ages 65 to 74 years |
| Hawaiians | 0.2 /100 | #268 | Tragic 5.7% |
| Immigrants | Colombia | 0.1 /100 | #269 | Tragic 5.7% |
| Immigrants | Nigeria | 0.1 /100 | #270 | Tragic 5.7% |
| Belizeans | 0.1 /100 | #271 | Tragic 5.7% |
| Yaqui | 0.1 /100 | #272 | Tragic 5.7% |
| Bahamians | 0.1 /100 | #273 | Tragic 5.7% |
| Immigrants | Guyana | 0.1 /100 | #274 | Tragic 5.7% |
| Immigrants | Liberia | 0.1 /100 | #275 | Tragic 5.7% |
| Somalis | 0.1 /100 | #276 | Tragic 5.7% |
| Immigrants | South America | 0.1 /100 | #277 | Tragic 5.7% |
| Mexican American Indians | 0.1 /100 | #278 | Tragic 5.7% |
| Immigrants | Norway | 0.1 /100 | #279 | Tragic 5.7% |
| Moroccans | 0.1 /100 | #280 | Tragic 5.7% |
| Immigrants | West Indies | 0.1 /100 | #281 | Tragic 5.7% |
| Ottawa | 0.1 /100 | #282 | Tragic 5.7% |
| Cypriots | 0.1 /100 | #283 | Tragic 5.7% |
| Chippewa | 0.1 /100 | #284 | Tragic 5.7% |
| Immigrants | Sierra Leone | 0.1 /100 | #285 | Tragic 5.7% |
| Marshallese | 0.1 /100 | #286 | Tragic 5.7% |
| Central American Indians | 0.0 /100 | #287 | Tragic 5.7% |
| Central Americans | 0.0 /100 | #288 | Tragic 5.7% |