Immigrants from Burma/Myanmar vs Mongolian Unemployment Among Ages 45 to 54 years
COMPARE
Immigrants from Burma/Myanmar
Mongolian
Unemployment Among Ages 45 to 54 years
Unemployment Among Ages 45 to 54 years Comparison
Immigrants from Burma/Myanmar
Mongolians
4.4%
UNEMPLOYMENT AMONG AGES 45 TO 54 YEARS
94.9/ 100
METRIC RATING
99th/ 347
METRIC RANK
4.3%
UNEMPLOYMENT AMONG AGES 45 TO 54 YEARS
96.6/ 100
METRIC RATING
92nd/ 347
METRIC RANK
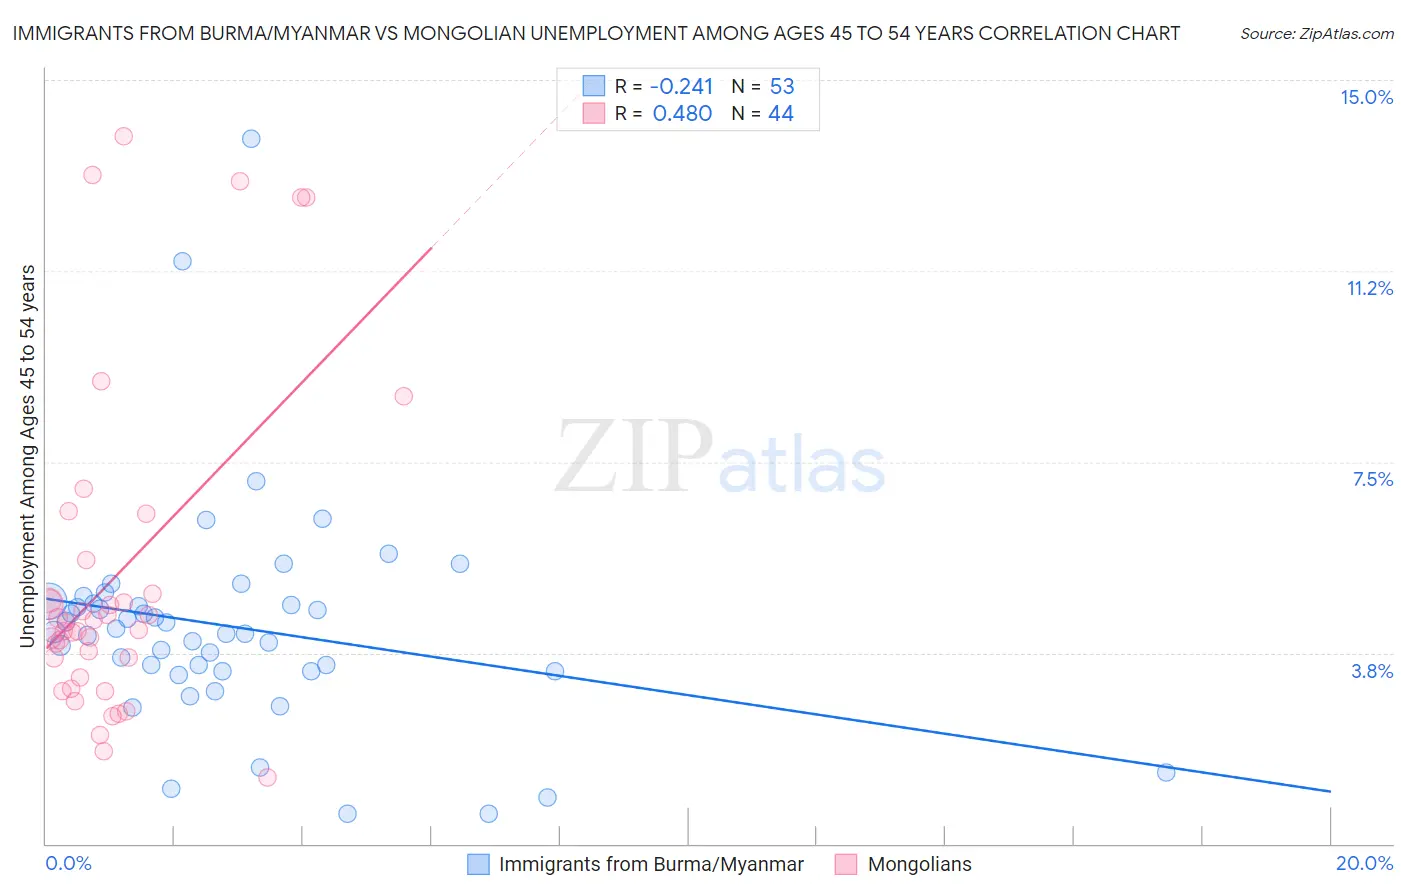
Immigrants from Burma/Myanmar vs Mongolian Unemployment Among Ages 45 to 54 years Correlation Chart
The statistical analysis conducted on geographies consisting of 170,673,740 people shows a weak negative correlation between the proportion of Immigrants from Burma/Myanmar and unemployment rate among population between the ages 45 and 54 in the United States with a correlation coefficient (R) of -0.241 and weighted average of 4.4%. Similarly, the statistical analysis conducted on geographies consisting of 139,150,754 people shows a moderate positive correlation between the proportion of Mongolians and unemployment rate among population between the ages 45 and 54 in the United States with a correlation coefficient (R) of 0.480 and weighted average of 4.3%, a difference of 0.51%.

Unemployment Among Ages 45 to 54 years Correlation Summary
| Measurement | Immigrants from Burma/Myanmar | Mongolian |
| Minimum | 0.60% | 1.3% |
| Maximum | 13.8% | 13.9% |
| Range | 13.2% | 12.6% |
| Mean | 4.3% | 5.3% |
| Median | 4.2% | 4.3% |
| Interquartile 25% (IQ1) | 3.4% | 3.5% |
| Interquartile 75% (IQ3) | 4.7% | 5.2% |
| Interquartile Range (IQR) | 1.3% | 1.8% |
| Standard Deviation (Sample) | 2.2% | 3.2% |
| Standard Deviation (Population) | 2.2% | 3.2% |
Demographics Similar to Immigrants from Burma/Myanmar and Mongolians by Unemployment Among Ages 45 to 54 years
In terms of unemployment among ages 45 to 54 years, the demographic groups most similar to Immigrants from Burma/Myanmar are Immigrants from Canada (4.4%, a difference of 0.020%), Romanian (4.4%, a difference of 0.020%), Immigrants from Eritrea (4.4%, a difference of 0.030%), Indonesian (4.4%, a difference of 0.15%), and Immigrants from North America (4.4%, a difference of 0.22%). Similarly, the demographic groups most similar to Mongolians are Argentinean (4.3%, a difference of 0.010%), Ukrainian (4.3%, a difference of 0.020%), Asian (4.3%, a difference of 0.090%), Immigrants from Malaysia (4.4%, a difference of 0.13%), and Immigrants from Argentina (4.3%, a difference of 0.14%).
| Demographics | Rating | Rank | Unemployment Among Ages 45 to 54 years |
| French | 97.3 /100 | #85 | Exceptional 4.3% |
| Ethiopians | 97.2 /100 | #86 | Exceptional 4.3% |
| Sudanese | 97.0 /100 | #87 | Exceptional 4.3% |
| Immigrants | Turkey | 96.9 /100 | #88 | Exceptional 4.3% |
| Immigrants | Argentina | 96.9 /100 | #89 | Exceptional 4.3% |
| Asians | 96.8 /100 | #90 | Exceptional 4.3% |
| Ukrainians | 96.6 /100 | #91 | Exceptional 4.3% |
| Mongolians | 96.6 /100 | #92 | Exceptional 4.3% |
| Argentineans | 96.5 /100 | #93 | Exceptional 4.3% |
| Immigrants | Malaysia | 96.2 /100 | #94 | Exceptional 4.4% |
| Immigrants | Ethiopia | 96.1 /100 | #95 | Exceptional 4.4% |
| Indonesians | 95.4 /100 | #96 | Exceptional 4.4% |
| Immigrants | Canada | 95.0 /100 | #97 | Exceptional 4.4% |
| Romanians | 94.9 /100 | #98 | Exceptional 4.4% |
| Immigrants | Burma/Myanmar | 94.9 /100 | #99 | Exceptional 4.4% |
| Immigrants | Eritrea | 94.7 /100 | #100 | Exceptional 4.4% |
| Immigrants | North America | 93.9 /100 | #101 | Exceptional 4.4% |
| Sri Lankans | 93.7 /100 | #102 | Exceptional 4.4% |
| Icelanders | 93.5 /100 | #103 | Exceptional 4.4% |
| Immigrants | Sweden | 93.0 /100 | #104 | Exceptional 4.4% |
| Immigrants | Kenya | 92.8 /100 | #105 | Exceptional 4.4% |