Immigrants from Burma/Myanmar vs Barbadian Unemployment Among Ages 45 to 54 years
COMPARE
Immigrants from Burma/Myanmar
Barbadian
Unemployment Among Ages 45 to 54 years
Unemployment Among Ages 45 to 54 years Comparison
Immigrants from Burma/Myanmar
Barbadians
4.4%
UNEMPLOYMENT AMONG AGES 45 TO 54 YEARS
94.9/ 100
METRIC RATING
99th/ 347
METRIC RANK
5.5%
UNEMPLOYMENT AMONG AGES 45 TO 54 YEARS
0.0/ 100
METRIC RATING
309th/ 347
METRIC RANK
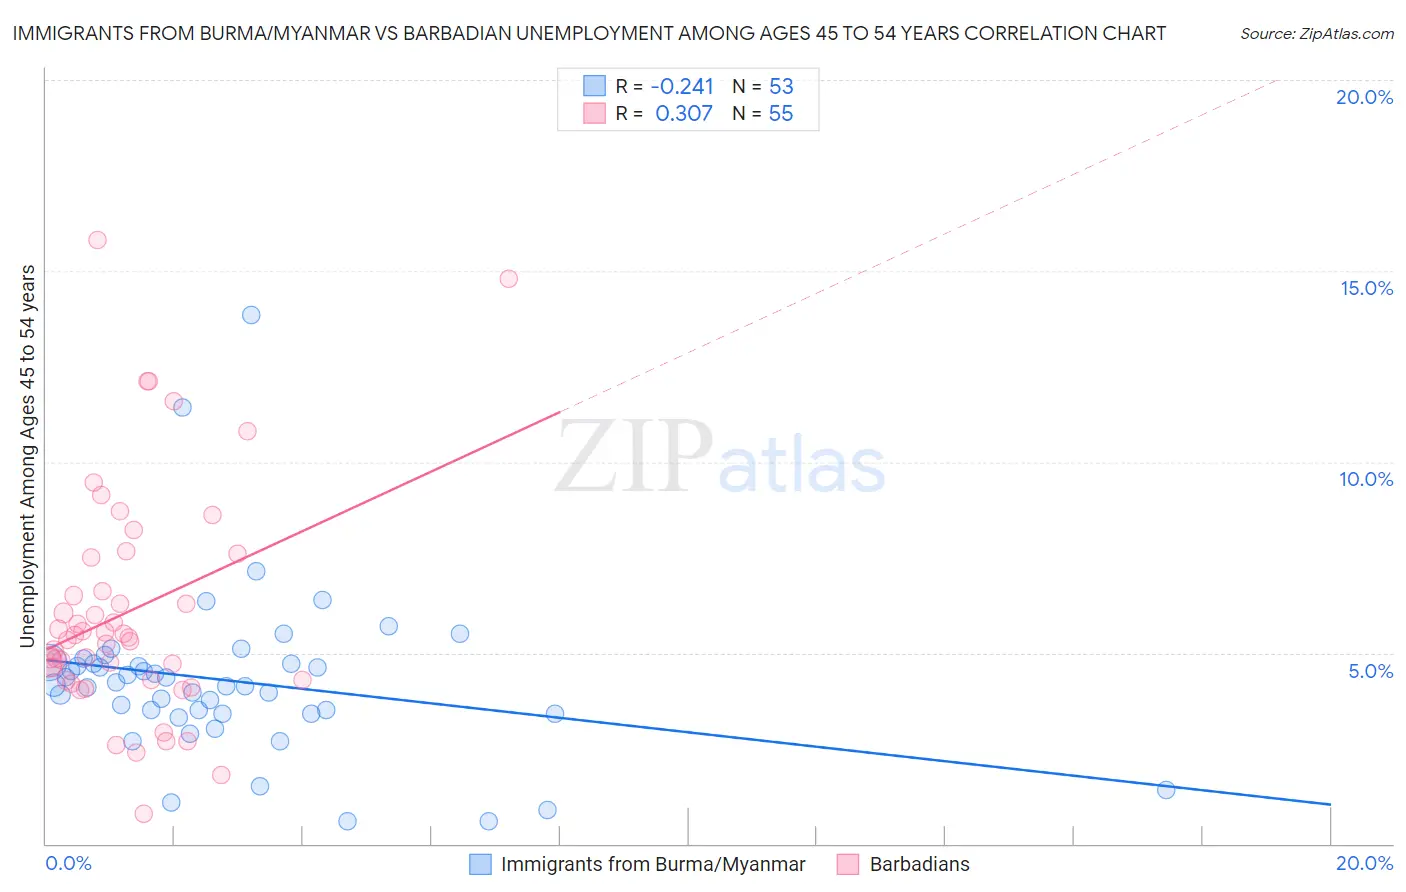
Immigrants from Burma/Myanmar vs Barbadian Unemployment Among Ages 45 to 54 years Correlation Chart
The statistical analysis conducted on geographies consisting of 170,673,740 people shows a weak negative correlation between the proportion of Immigrants from Burma/Myanmar and unemployment rate among population between the ages 45 and 54 in the United States with a correlation coefficient (R) of -0.241 and weighted average of 4.4%. Similarly, the statistical analysis conducted on geographies consisting of 140,224,608 people shows a mild positive correlation between the proportion of Barbadians and unemployment rate among population between the ages 45 and 54 in the United States with a correlation coefficient (R) of 0.307 and weighted average of 5.5%, a difference of 25.1%.
Unemployment Among Ages 45 to 54 years Correlation Summary
| Measurement | Immigrants from Burma/Myanmar | Barbadian |
| Minimum | 0.60% | 0.80% |
| Maximum | 13.8% | 15.8% |
| Range | 13.2% | 15.0% |
| Mean | 4.3% | 6.1% |
| Median | 4.2% | 5.4% |
| Interquartile 25% (IQ1) | 3.4% | 4.3% |
| Interquartile 75% (IQ3) | 4.7% | 7.5% |
| Interquartile Range (IQR) | 1.3% | 3.2% |
| Standard Deviation (Sample) | 2.2% | 3.0% |
| Standard Deviation (Population) | 2.2% | 3.0% |
Similar Demographics by Unemployment Among Ages 45 to 54 years
Demographics Similar to Immigrants from Burma/Myanmar by Unemployment Among Ages 45 to 54 years
In terms of unemployment among ages 45 to 54 years, the demographic groups most similar to Immigrants from Burma/Myanmar are Immigrants from Canada (4.4%, a difference of 0.020%), Romanian (4.4%, a difference of 0.020%), Immigrants from Eritrea (4.4%, a difference of 0.030%), Indonesian (4.4%, a difference of 0.15%), and Immigrants from North America (4.4%, a difference of 0.22%).
| Demographics | Rating | Rank | Unemployment Among Ages 45 to 54 years |
| Mongolians | 96.6 /100 | #92 | Exceptional 4.3% |
| Argentineans | 96.5 /100 | #93 | Exceptional 4.3% |
| Immigrants | Malaysia | 96.2 /100 | #94 | Exceptional 4.4% |
| Immigrants | Ethiopia | 96.1 /100 | #95 | Exceptional 4.4% |
| Indonesians | 95.4 /100 | #96 | Exceptional 4.4% |
| Immigrants | Canada | 95.0 /100 | #97 | Exceptional 4.4% |
| Romanians | 94.9 /100 | #98 | Exceptional 4.4% |
| Immigrants | Burma/Myanmar | 94.9 /100 | #99 | Exceptional 4.4% |
| Immigrants | Eritrea | 94.7 /100 | #100 | Exceptional 4.4% |
| Immigrants | North America | 93.9 /100 | #101 | Exceptional 4.4% |
| Sri Lankans | 93.7 /100 | #102 | Exceptional 4.4% |
| Icelanders | 93.5 /100 | #103 | Exceptional 4.4% |
| Immigrants | Sweden | 93.0 /100 | #104 | Exceptional 4.4% |
| Immigrants | Kenya | 92.8 /100 | #105 | Exceptional 4.4% |
| Iranians | 92.5 /100 | #106 | Exceptional 4.4% |
Demographics Similar to Barbadians by Unemployment Among Ages 45 to 54 years
In terms of unemployment among ages 45 to 54 years, the demographic groups most similar to Barbadians are Immigrants from Barbados (5.5%, a difference of 0.15%), Chippewa (5.5%, a difference of 0.44%), Black/African American (5.4%, a difference of 0.65%), Vietnamese (5.4%, a difference of 1.4%), and Immigrants from Bangladesh (5.4%, a difference of 1.7%).
| Demographics | Rating | Rank | Unemployment Among Ages 45 to 54 years |
| Immigrants | Ecuador | 0.0 /100 | #302 | Tragic 5.3% |
| Immigrants | Belize | 0.0 /100 | #303 | Tragic 5.3% |
| Immigrants | Jamaica | 0.0 /100 | #304 | Tragic 5.4% |
| Immigrants | West Indies | 0.0 /100 | #305 | Tragic 5.4% |
| Immigrants | Bangladesh | 0.0 /100 | #306 | Tragic 5.4% |
| Vietnamese | 0.0 /100 | #307 | Tragic 5.4% |
| Blacks/African Americans | 0.0 /100 | #308 | Tragic 5.4% |
| Barbadians | 0.0 /100 | #309 | Tragic 5.5% |
| Immigrants | Barbados | 0.0 /100 | #310 | Tragic 5.5% |
| Chippewa | 0.0 /100 | #311 | Tragic 5.5% |
| Immigrants | Grenada | 0.0 /100 | #312 | Tragic 5.6% |
| Shoshone | 0.0 /100 | #313 | Tragic 5.6% |
| Guyanese | 0.0 /100 | #314 | Tragic 5.6% |
| Immigrants | Dominica | 0.0 /100 | #315 | Tragic 5.6% |
| Immigrants | Guyana | 0.0 /100 | #316 | Tragic 5.6% |