Immigrants from Burma/Myanmar vs Ottawa Unemployment Among Youth under 25 years
COMPARE
Immigrants from Burma/Myanmar
Ottawa
Unemployment Among Youth under 25 years
Unemployment Among Youth under 25 years Comparison
Immigrants from Burma/Myanmar
Ottawa
10.6%
UNEMPLOYMENT AMONG YOUTH UNDER 25 YEARS
100.0/ 100
METRIC RATING
19th/ 347
METRIC RANK
11.1%
UNEMPLOYMENT AMONG YOUTH UNDER 25 YEARS
99.0/ 100
METRIC RATING
53rd/ 347
METRIC RANK
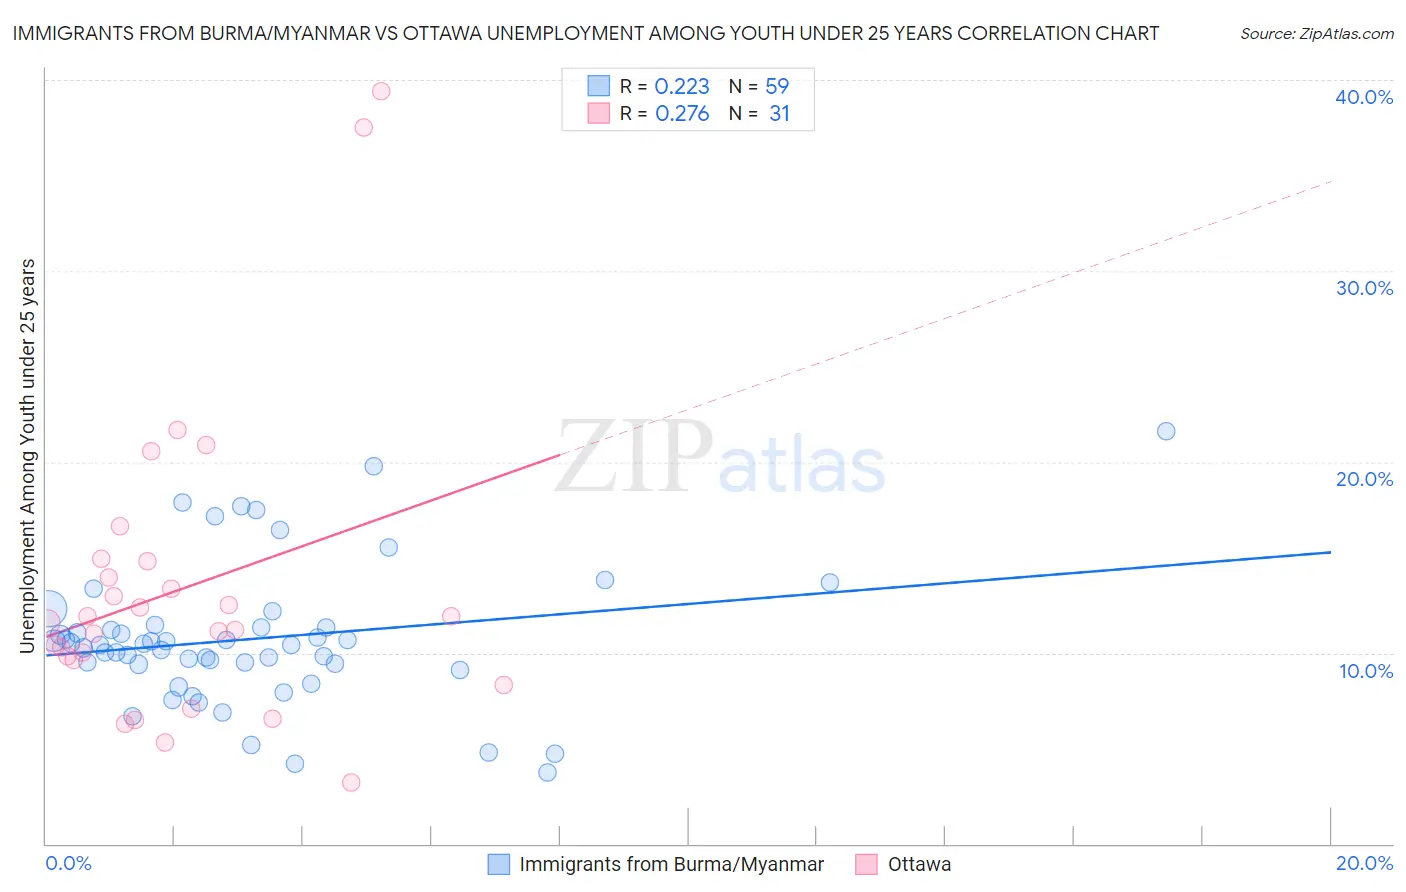
Immigrants from Burma/Myanmar vs Ottawa Unemployment Among Youth under 25 years Correlation Chart
The statistical analysis conducted on geographies consisting of 171,764,683 people shows a weak positive correlation between the proportion of Immigrants from Burma/Myanmar and unemployment rate among youth under the age of 25 in the United States with a correlation coefficient (R) of 0.223 and weighted average of 10.6%. Similarly, the statistical analysis conducted on geographies consisting of 49,687,852 people shows a weak positive correlation between the proportion of Ottawa and unemployment rate among youth under the age of 25 in the United States with a correlation coefficient (R) of 0.276 and weighted average of 11.1%, a difference of 4.4%.
Unemployment Among Youth under 25 years Correlation Summary
| Measurement | Immigrants from Burma/Myanmar | Ottawa |
| Minimum | 3.7% | 3.2% |
| Maximum | 21.6% | 39.4% |
| Range | 17.9% | 36.2% |
| Mean | 10.7% | 13.3% |
| Median | 10.4% | 11.6% |
| Interquartile 25% (IQ1) | 9.4% | 9.6% |
| Interquartile 75% (IQ3) | 11.3% | 14.8% |
| Interquartile Range (IQR) | 1.9% | 5.2% |
| Standard Deviation (Sample) | 3.6% | 8.0% |
| Standard Deviation (Population) | 3.6% | 7.9% |
Similar Demographics by Unemployment Among Youth under 25 years
Demographics Similar to Immigrants from Burma/Myanmar by Unemployment Among Youth under 25 years
In terms of unemployment among youth under 25 years, the demographic groups most similar to Immigrants from Burma/Myanmar are Swiss (10.6%, a difference of 0.010%), Dutch (10.6%, a difference of 0.020%), Menominee (10.6%, a difference of 0.17%), Sudanese (10.6%, a difference of 0.22%), and Venezuelan (10.6%, a difference of 0.22%).
| Demographics | Rating | Rank | Unemployment Among Youth under 25 years |
| Immigrants | Sudan | 100.0 /100 | #12 | Exceptional 10.5% |
| Indonesians | 100.0 /100 | #13 | Exceptional 10.6% |
| Cubans | 100.0 /100 | #14 | Exceptional 10.6% |
| Sudanese | 100.0 /100 | #15 | Exceptional 10.6% |
| Venezuelans | 100.0 /100 | #16 | Exceptional 10.6% |
| Menominee | 100.0 /100 | #17 | Exceptional 10.6% |
| Swiss | 100.0 /100 | #18 | Exceptional 10.6% |
| Immigrants | Burma/Myanmar | 100.0 /100 | #19 | Exceptional 10.6% |
| Dutch | 100.0 /100 | #20 | Exceptional 10.6% |
| Pennsylvania Germans | 100.0 /100 | #21 | Exceptional 10.6% |
| Belgians | 100.0 /100 | #22 | Exceptional 10.6% |
| Immigrants | Bosnia and Herzegovina | 100.0 /100 | #23 | Exceptional 10.6% |
| Finns | 100.0 /100 | #24 | Exceptional 10.7% |
| Immigrants | North Macedonia | 100.0 /100 | #25 | Exceptional 10.7% |
| Immigrants | India | 100.0 /100 | #26 | Exceptional 10.7% |
Demographics Similar to Ottawa by Unemployment Among Youth under 25 years
In terms of unemployment among youth under 25 years, the demographic groups most similar to Ottawa are Latvian (11.0%, a difference of 0.090%), Mongolian (11.1%, a difference of 0.090%), Irish (11.1%, a difference of 0.090%), Serbian (11.0%, a difference of 0.10%), and Immigrants from Saudi Arabia (11.1%, a difference of 0.11%).
| Demographics | Rating | Rank | Unemployment Among Youth under 25 years |
| Tongans | 99.6 /100 | #46 | Exceptional 10.9% |
| Australians | 99.6 /100 | #47 | Exceptional 10.9% |
| Poles | 99.3 /100 | #48 | Exceptional 11.0% |
| Thais | 99.3 /100 | #49 | Exceptional 11.0% |
| Czechoslovakians | 99.2 /100 | #50 | Exceptional 11.0% |
| Serbians | 99.0 /100 | #51 | Exceptional 11.0% |
| Latvians | 99.0 /100 | #52 | Exceptional 11.0% |
| Ottawa | 99.0 /100 | #53 | Exceptional 11.1% |
| Mongolians | 98.9 /100 | #54 | Exceptional 11.1% |
| Irish | 98.9 /100 | #55 | Exceptional 11.1% |
| Immigrants | Saudi Arabia | 98.8 /100 | #56 | Exceptional 11.1% |
| Immigrants | Eritrea | 98.8 /100 | #57 | Exceptional 11.1% |
| Scotch-Irish | 98.8 /100 | #58 | Exceptional 11.1% |
| Immigrants | Eastern Africa | 98.7 /100 | #59 | Exceptional 11.1% |
| South Africans | 98.5 /100 | #60 | Exceptional 11.1% |