Immigrants from Bosnia and Herzegovina vs Panamanian Male Unemployment
COMPARE
Immigrants from Bosnia and Herzegovina
Panamanian
Male Unemployment
Male Unemployment Comparison
Immigrants from Bosnia and Herzegovina
Panamanians
4.9%
MALE UNEMPLOYMENT
99.4/ 100
METRIC RATING
38th/ 347
METRIC RANK
5.6%
MALE UNEMPLOYMENT
1.9/ 100
METRIC RATING
225th/ 347
METRIC RANK
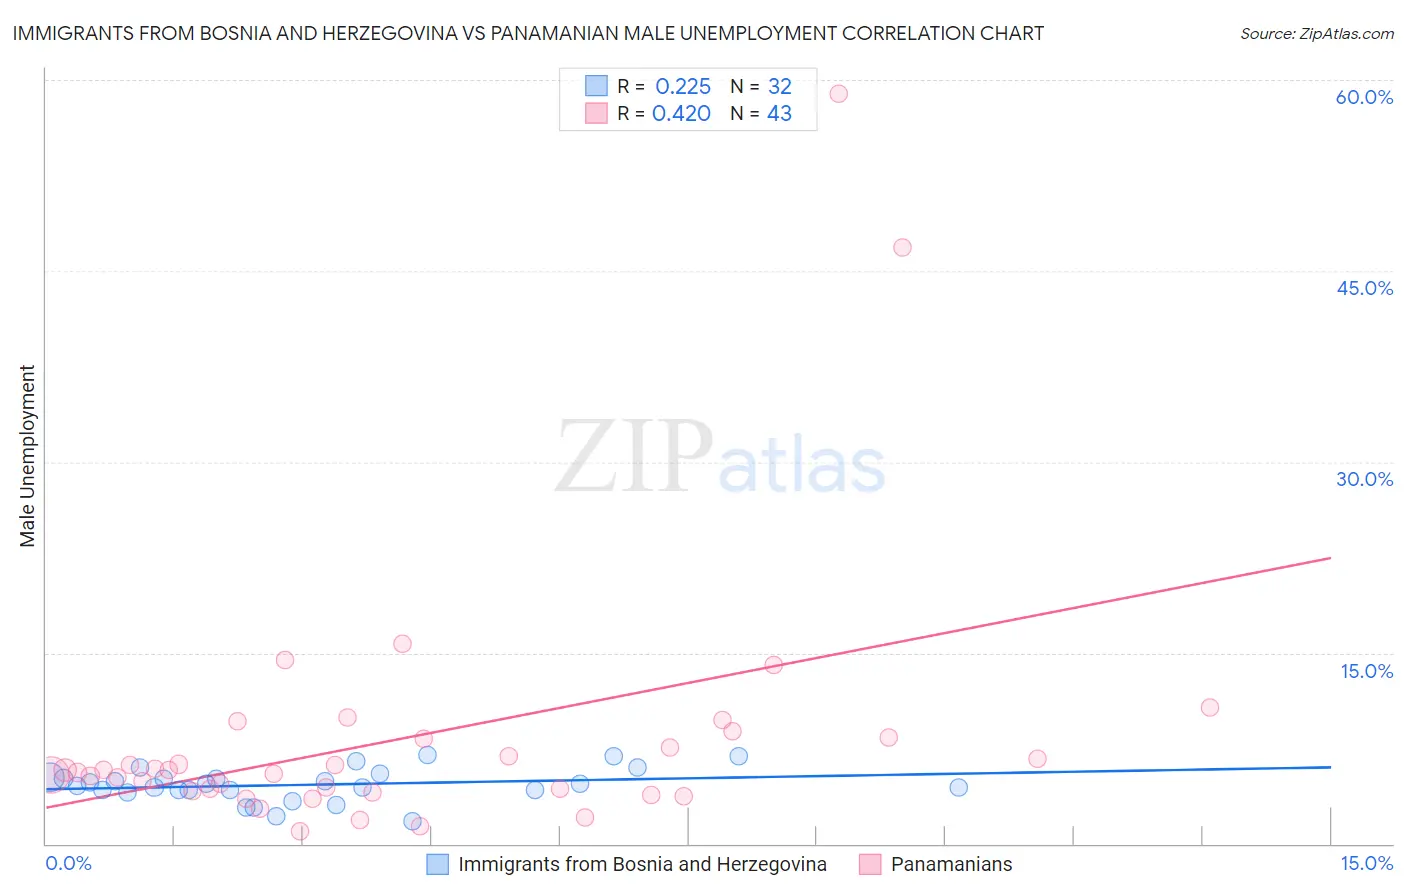
Immigrants from Bosnia and Herzegovina vs Panamanian Male Unemployment Correlation Chart
The statistical analysis conducted on geographies consisting of 156,632,183 people shows a weak positive correlation between the proportion of Immigrants from Bosnia and Herzegovina and unemployment rate among males in the United States with a correlation coefficient (R) of 0.225 and weighted average of 4.9%. Similarly, the statistical analysis conducted on geographies consisting of 280,561,708 people shows a moderate positive correlation between the proportion of Panamanians and unemployment rate among males in the United States with a correlation coefficient (R) of 0.420 and weighted average of 5.6%, a difference of 14.1%.
Male Unemployment Correlation Summary
| Measurement | Immigrants from Bosnia and Herzegovina | Panamanian |
| Minimum | 1.8% | 1.0% |
| Maximum | 7.0% | 58.9% |
| Range | 5.2% | 57.9% |
| Mean | 4.6% | 8.4% |
| Median | 4.6% | 5.8% |
| Interquartile 25% (IQ1) | 4.2% | 4.2% |
| Interquartile 75% (IQ3) | 5.2% | 8.3% |
| Interquartile Range (IQR) | 0.99% | 4.1% |
| Standard Deviation (Sample) | 1.3% | 10.5% |
| Standard Deviation (Population) | 1.3% | 10.4% |
Similar Demographics by Male Unemployment
Demographics Similar to Immigrants from Bosnia and Herzegovina by Male Unemployment
In terms of male unemployment, the demographic groups most similar to Immigrants from Bosnia and Herzegovina are Scotch-Irish (4.9%, a difference of 0.020%), Burmese (4.9%, a difference of 0.070%), Northern European (4.9%, a difference of 0.15%), Immigrants from Singapore (4.9%, a difference of 0.23%), and Chinese (4.9%, a difference of 0.24%).
| Demographics | Rating | Rank | Male Unemployment |
| Sudanese | 99.8 /100 | #31 | Exceptional 4.8% |
| Immigrants | Nepal | 99.8 /100 | #32 | Exceptional 4.8% |
| Latvians | 99.7 /100 | #33 | Exceptional 4.8% |
| Welsh | 99.7 /100 | #34 | Exceptional 4.8% |
| Paraguayans | 99.5 /100 | #35 | Exceptional 4.9% |
| Immigrants | Singapore | 99.4 /100 | #36 | Exceptional 4.9% |
| Scotch-Irish | 99.4 /100 | #37 | Exceptional 4.9% |
| Immigrants | Bosnia and Herzegovina | 99.4 /100 | #38 | Exceptional 4.9% |
| Burmese | 99.3 /100 | #39 | Exceptional 4.9% |
| Northern Europeans | 99.3 /100 | #40 | Exceptional 4.9% |
| Chinese | 99.3 /100 | #41 | Exceptional 4.9% |
| Immigrants | Belgium | 99.2 /100 | #42 | Exceptional 4.9% |
| Immigrants | Japan | 99.2 /100 | #43 | Exceptional 4.9% |
| Immigrants | Korea | 99.1 /100 | #44 | Exceptional 4.9% |
| Immigrants | Zimbabwe | 99.0 /100 | #45 | Exceptional 4.9% |
Demographics Similar to Panamanians by Male Unemployment
In terms of male unemployment, the demographic groups most similar to Panamanians are Immigrants from Cambodia (5.6%, a difference of 0.090%), Immigrants from Panama (5.6%, a difference of 0.090%), Seminole (5.6%, a difference of 0.11%), Central American (5.6%, a difference of 0.11%), and Immigrants from Africa (5.6%, a difference of 0.15%).
| Demographics | Rating | Rank | Male Unemployment |
| Immigrants | Albania | 3.6 /100 | #218 | Tragic 5.5% |
| Immigrants | Western Asia | 3.5 /100 | #219 | Tragic 5.6% |
| Portuguese | 3.5 /100 | #220 | Tragic 5.6% |
| Soviet Union | 3.2 /100 | #221 | Tragic 5.6% |
| Immigrants | Micronesia | 2.9 /100 | #222 | Tragic 5.6% |
| Creek | 2.6 /100 | #223 | Tragic 5.6% |
| Cherokee | 2.4 /100 | #224 | Tragic 5.6% |
| Panamanians | 1.9 /100 | #225 | Tragic 5.6% |
| Immigrants | Cambodia | 1.8 /100 | #226 | Tragic 5.6% |
| Immigrants | Panama | 1.8 /100 | #227 | Tragic 5.6% |
| Seminole | 1.8 /100 | #228 | Tragic 5.6% |
| Central Americans | 1.8 /100 | #229 | Tragic 5.6% |
| Immigrants | Africa | 1.7 /100 | #230 | Tragic 5.6% |
| Choctaw | 1.6 /100 | #231 | Tragic 5.6% |
| Moroccans | 1.6 /100 | #232 | Tragic 5.6% |