Immigrants from Bosnia and Herzegovina vs Bulgarian Male Unemployment
COMPARE
Immigrants from Bosnia and Herzegovina
Bulgarian
Male Unemployment
Male Unemployment Comparison
Immigrants from Bosnia and Herzegovina
Bulgarians
4.9%
MALE UNEMPLOYMENT
99.4/ 100
METRIC RATING
38th/ 347
METRIC RANK
4.8%
MALE UNEMPLOYMENT
99.8/ 100
METRIC RATING
28th/ 347
METRIC RANK
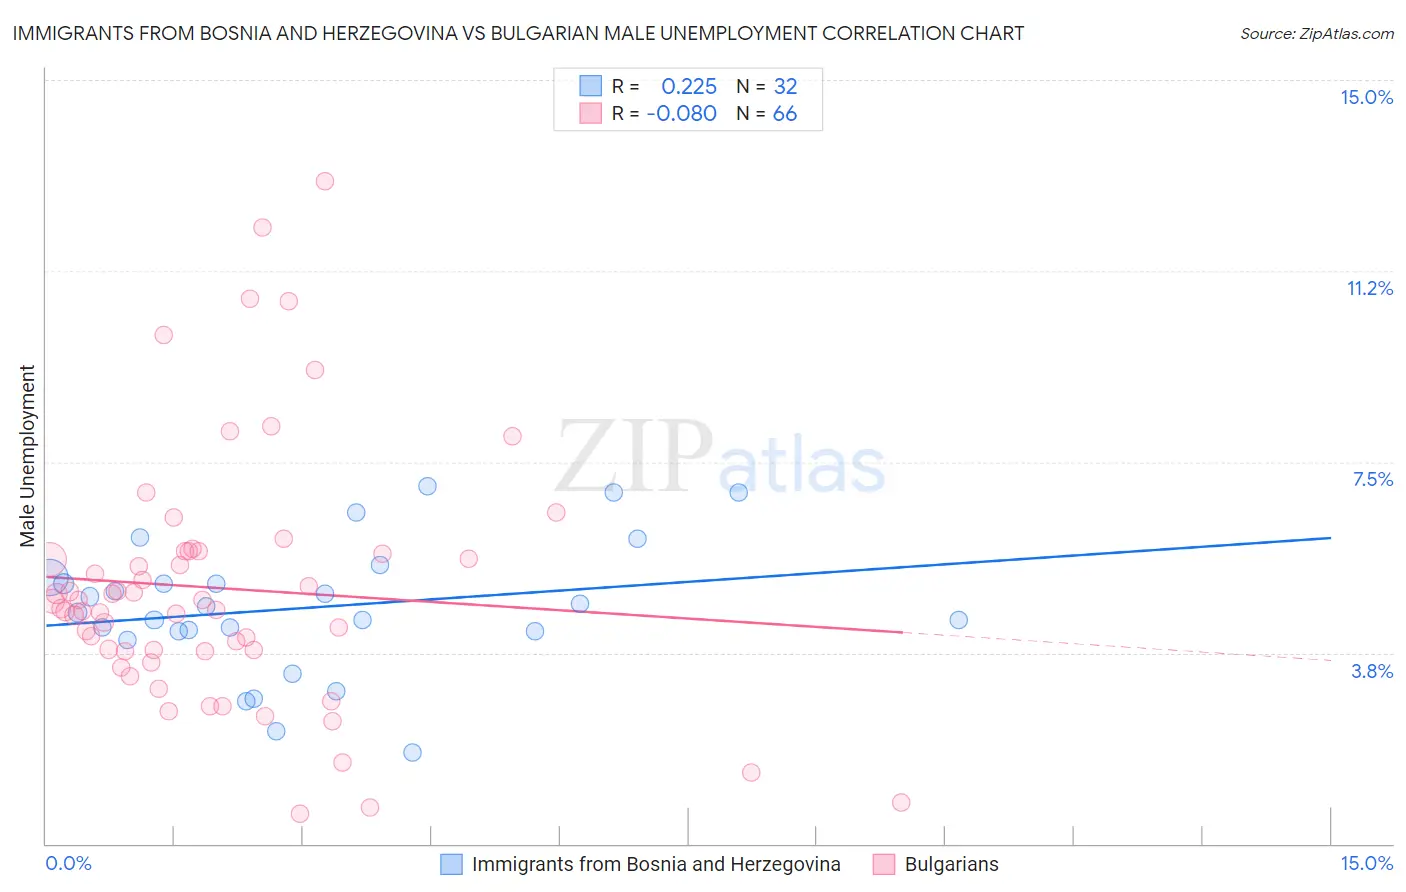
Immigrants from Bosnia and Herzegovina vs Bulgarian Male Unemployment Correlation Chart
The statistical analysis conducted on geographies consisting of 156,632,183 people shows a weak positive correlation between the proportion of Immigrants from Bosnia and Herzegovina and unemployment rate among males in the United States with a correlation coefficient (R) of 0.225 and weighted average of 4.9%. Similarly, the statistical analysis conducted on geographies consisting of 205,333,141 people shows a slight negative correlation between the proportion of Bulgarians and unemployment rate among males in the United States with a correlation coefficient (R) of -0.080 and weighted average of 4.8%, a difference of 2.3%.
Male Unemployment Correlation Summary
| Measurement | Immigrants from Bosnia and Herzegovina | Bulgarian |
| Minimum | 1.8% | 0.60% |
| Maximum | 7.0% | 13.0% |
| Range | 5.2% | 12.4% |
| Mean | 4.6% | 5.0% |
| Median | 4.6% | 4.7% |
| Interquartile 25% (IQ1) | 4.2% | 3.8% |
| Interquartile 75% (IQ3) | 5.2% | 5.7% |
| Interquartile Range (IQR) | 0.99% | 1.9% |
| Standard Deviation (Sample) | 1.3% | 2.5% |
| Standard Deviation (Population) | 1.3% | 2.5% |
Demographics Similar to Immigrants from Bosnia and Herzegovina and Bulgarians by Male Unemployment
In terms of male unemployment, the demographic groups most similar to Immigrants from Bosnia and Herzegovina are Scotch-Irish (4.9%, a difference of 0.020%), Burmese (4.9%, a difference of 0.070%), Northern European (4.9%, a difference of 0.15%), Immigrants from Singapore (4.9%, a difference of 0.23%), and Chinese (4.9%, a difference of 0.24%). Similarly, the demographic groups most similar to Bulgarians are Scottish (4.8%, a difference of 0.13%), Belgian (4.8%, a difference of 0.18%), Dutch (4.8%, a difference of 0.38%), Zimbabwean (4.8%, a difference of 0.40%), and British (4.8%, a difference of 0.44%).
| Demographics | Rating | Rank | Male Unemployment |
| Tongans | 99.9 /100 | #23 | Exceptional 4.8% |
| Immigrants | South Central Asia | 99.9 /100 | #24 | Exceptional 4.8% |
| Zimbabweans | 99.9 /100 | #25 | Exceptional 4.8% |
| Dutch | 99.9 /100 | #26 | Exceptional 4.8% |
| Belgians | 99.9 /100 | #27 | Exceptional 4.8% |
| Bulgarians | 99.8 /100 | #28 | Exceptional 4.8% |
| Scottish | 99.8 /100 | #29 | Exceptional 4.8% |
| British | 99.8 /100 | #30 | Exceptional 4.8% |
| Sudanese | 99.8 /100 | #31 | Exceptional 4.8% |
| Immigrants | Nepal | 99.8 /100 | #32 | Exceptional 4.8% |
| Latvians | 99.7 /100 | #33 | Exceptional 4.8% |
| Welsh | 99.7 /100 | #34 | Exceptional 4.8% |
| Paraguayans | 99.5 /100 | #35 | Exceptional 4.9% |
| Immigrants | Singapore | 99.4 /100 | #36 | Exceptional 4.9% |
| Scotch-Irish | 99.4 /100 | #37 | Exceptional 4.9% |
| Immigrants | Bosnia and Herzegovina | 99.4 /100 | #38 | Exceptional 4.9% |
| Burmese | 99.3 /100 | #39 | Exceptional 4.9% |
| Northern Europeans | 99.3 /100 | #40 | Exceptional 4.9% |
| Chinese | 99.3 /100 | #41 | Exceptional 4.9% |
| Immigrants | Belgium | 99.2 /100 | #42 | Exceptional 4.9% |
| Immigrants | Japan | 99.2 /100 | #43 | Exceptional 4.9% |