Immigrants from Denmark vs Panamanian Male Unemployment
COMPARE
Immigrants from Denmark
Panamanian
Male Unemployment
Male Unemployment Comparison
Immigrants from Denmark
Panamanians
5.1%
MALE UNEMPLOYMENT
89.4/ 100
METRIC RATING
116th/ 347
METRIC RANK
5.6%
MALE UNEMPLOYMENT
1.9/ 100
METRIC RATING
225th/ 347
METRIC RANK
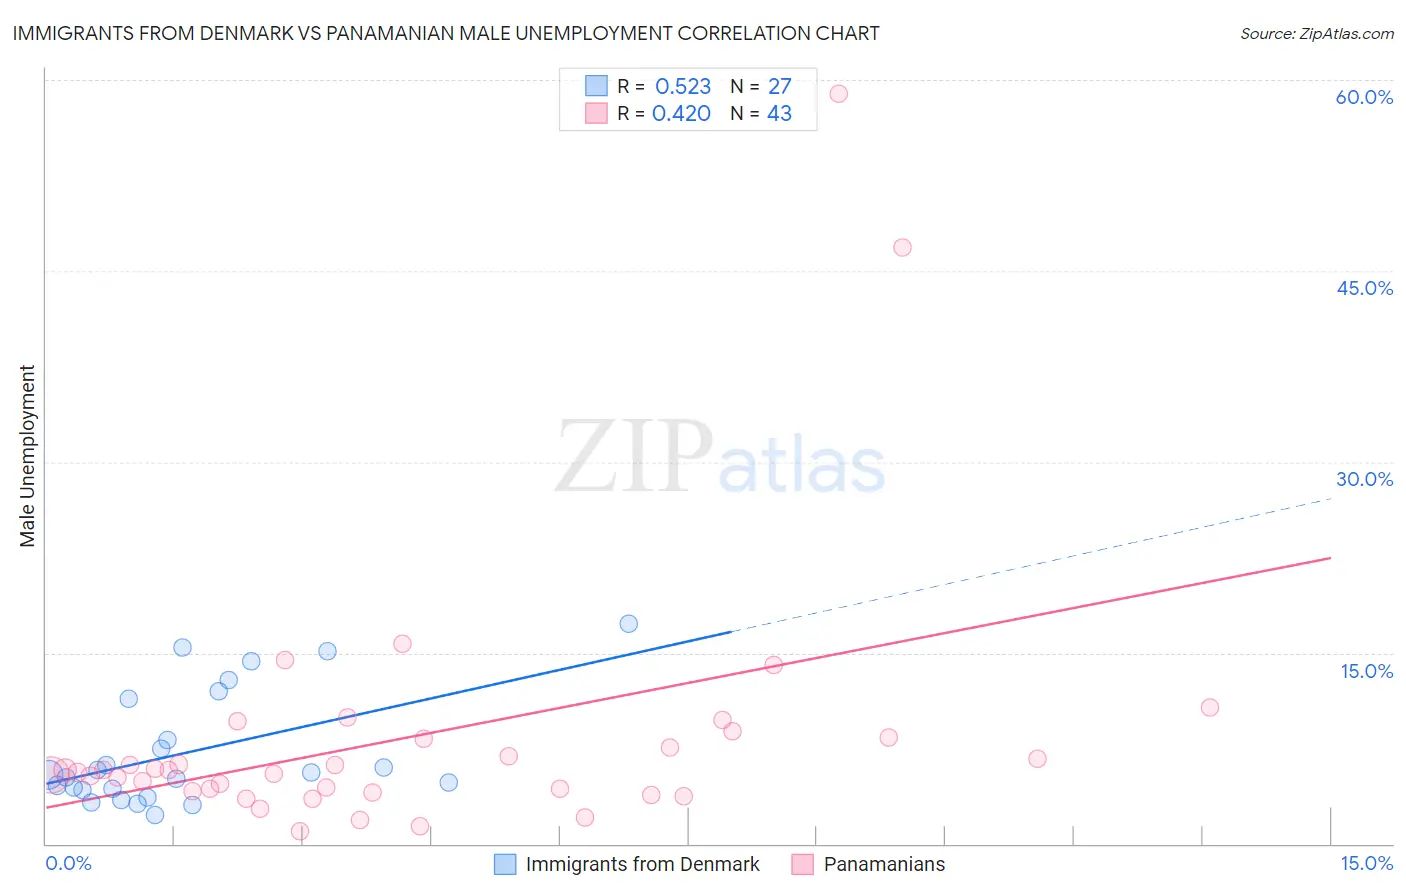
Immigrants from Denmark vs Panamanian Male Unemployment Correlation Chart
The statistical analysis conducted on geographies consisting of 136,170,297 people shows a substantial positive correlation between the proportion of Immigrants from Denmark and unemployment rate among males in the United States with a correlation coefficient (R) of 0.523 and weighted average of 5.1%. Similarly, the statistical analysis conducted on geographies consisting of 280,561,708 people shows a moderate positive correlation between the proportion of Panamanians and unemployment rate among males in the United States with a correlation coefficient (R) of 0.420 and weighted average of 5.6%, a difference of 9.1%.
Male Unemployment Correlation Summary
| Measurement | Immigrants from Denmark | Panamanian |
| Minimum | 2.2% | 1.0% |
| Maximum | 17.3% | 58.9% |
| Range | 15.1% | 57.9% |
| Mean | 7.2% | 8.4% |
| Median | 5.4% | 5.8% |
| Interquartile 25% (IQ1) | 4.3% | 4.2% |
| Interquartile 75% (IQ3) | 11.4% | 8.3% |
| Interquartile Range (IQR) | 7.1% | 4.1% |
| Standard Deviation (Sample) | 4.4% | 10.5% |
| Standard Deviation (Population) | 4.4% | 10.4% |
Similar Demographics by Male Unemployment
Demographics Similar to Immigrants from Denmark by Male Unemployment
In terms of male unemployment, the demographic groups most similar to Immigrants from Denmark are Immigrants from Asia (5.1%, a difference of 0.040%), Estonian (5.1%, a difference of 0.050%), Romanian (5.1%, a difference of 0.070%), Cypriot (5.1%, a difference of 0.080%), and French Canadian (5.1%, a difference of 0.12%).
| Demographics | Rating | Rank | Male Unemployment |
| Immigrants | Pakistan | 90.9 /100 | #109 | Exceptional 5.1% |
| Immigrants | England | 90.8 /100 | #110 | Exceptional 5.1% |
| Immigrants | Eastern Asia | 90.8 /100 | #111 | Exceptional 5.1% |
| Immigrants | Moldova | 90.3 /100 | #112 | Exceptional 5.1% |
| Immigrants | Austria | 90.3 /100 | #113 | Exceptional 5.1% |
| Romanians | 89.8 /100 | #114 | Excellent 5.1% |
| Immigrants | Asia | 89.6 /100 | #115 | Excellent 5.1% |
| Immigrants | Denmark | 89.4 /100 | #116 | Excellent 5.1% |
| Estonians | 89.0 /100 | #117 | Excellent 5.1% |
| Cypriots | 88.8 /100 | #118 | Excellent 5.1% |
| French Canadians | 88.6 /100 | #119 | Excellent 5.1% |
| Ukrainians | 88.4 /100 | #120 | Excellent 5.1% |
| Mongolians | 88.4 /100 | #121 | Excellent 5.1% |
| Nicaraguans | 88.2 /100 | #122 | Excellent 5.1% |
| Palestinians | 87.7 /100 | #123 | Excellent 5.1% |
Demographics Similar to Panamanians by Male Unemployment
In terms of male unemployment, the demographic groups most similar to Panamanians are Immigrants from Cambodia (5.6%, a difference of 0.090%), Immigrants from Panama (5.6%, a difference of 0.090%), Seminole (5.6%, a difference of 0.11%), Central American (5.6%, a difference of 0.11%), and Immigrants from Africa (5.6%, a difference of 0.15%).
| Demographics | Rating | Rank | Male Unemployment |
| Immigrants | Albania | 3.6 /100 | #218 | Tragic 5.5% |
| Immigrants | Western Asia | 3.5 /100 | #219 | Tragic 5.6% |
| Portuguese | 3.5 /100 | #220 | Tragic 5.6% |
| Soviet Union | 3.2 /100 | #221 | Tragic 5.6% |
| Immigrants | Micronesia | 2.9 /100 | #222 | Tragic 5.6% |
| Creek | 2.6 /100 | #223 | Tragic 5.6% |
| Cherokee | 2.4 /100 | #224 | Tragic 5.6% |
| Panamanians | 1.9 /100 | #225 | Tragic 5.6% |
| Immigrants | Cambodia | 1.8 /100 | #226 | Tragic 5.6% |
| Immigrants | Panama | 1.8 /100 | #227 | Tragic 5.6% |
| Seminole | 1.8 /100 | #228 | Tragic 5.6% |
| Central Americans | 1.8 /100 | #229 | Tragic 5.6% |
| Immigrants | Africa | 1.7 /100 | #230 | Tragic 5.6% |
| Choctaw | 1.6 /100 | #231 | Tragic 5.6% |
| Moroccans | 1.6 /100 | #232 | Tragic 5.6% |