Immigrants from Bolivia vs Guamanian/Chamorro Female Unemployment
COMPARE
Immigrants from Bolivia
Guamanian/Chamorro
Female Unemployment
Female Unemployment Comparison
Immigrants from Bolivia
Guamanians/Chamorros
5.0%
FEMALE UNEMPLOYMENT
98.0/ 100
METRIC RATING
74th/ 347
METRIC RANK
5.6%
FEMALE UNEMPLOYMENT
1.4/ 100
METRIC RATING
245th/ 347
METRIC RANK
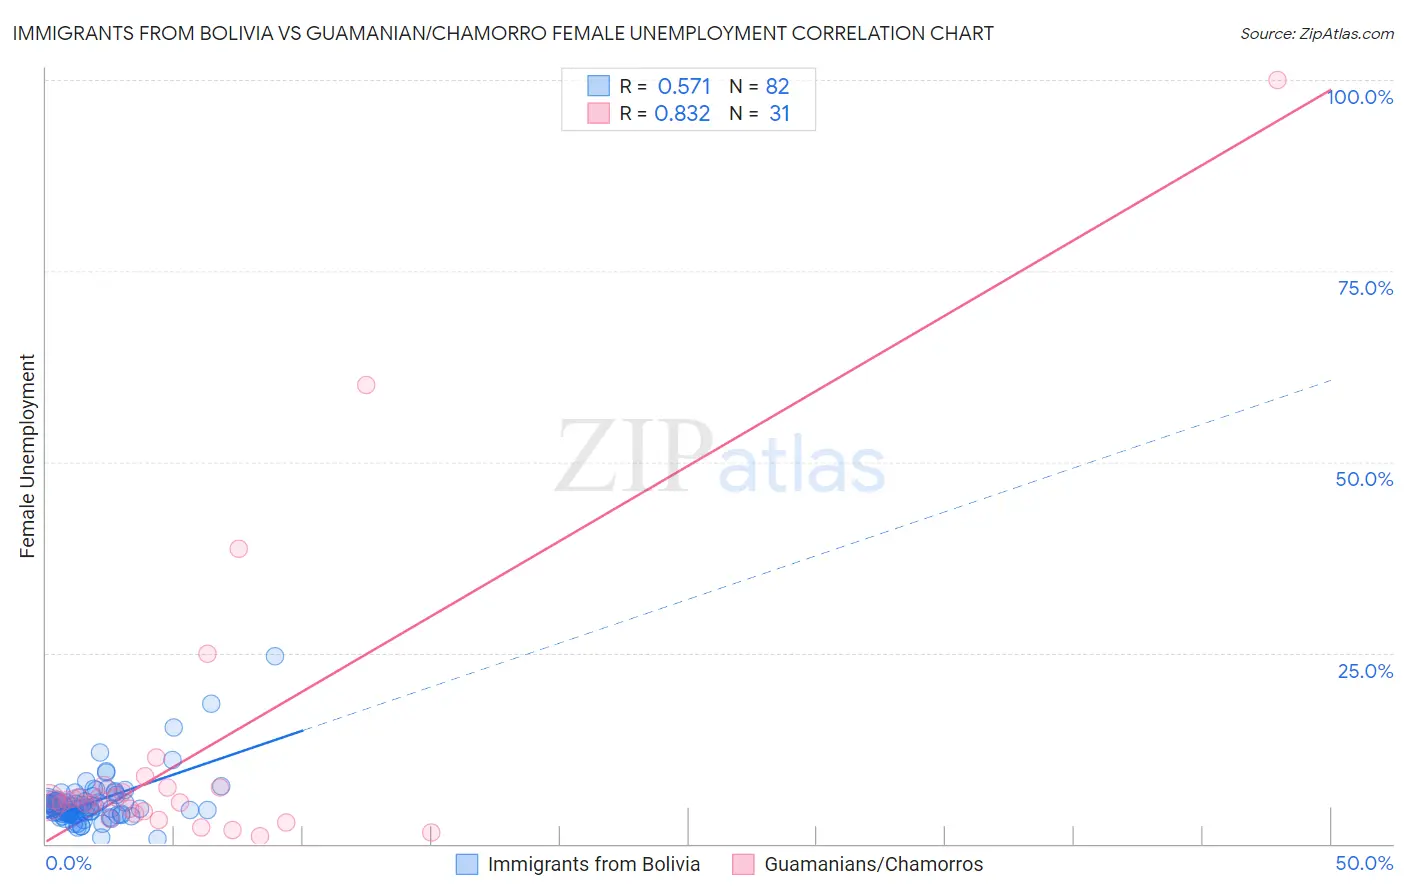
Immigrants from Bolivia vs Guamanian/Chamorro Female Unemployment Correlation Chart
The statistical analysis conducted on geographies consisting of 158,575,090 people shows a substantial positive correlation between the proportion of Immigrants from Bolivia and unemploymnet rate among females in the United States with a correlation coefficient (R) of 0.571 and weighted average of 5.0%. Similarly, the statistical analysis conducted on geographies consisting of 221,394,828 people shows a very strong positive correlation between the proportion of Guamanians/Chamorros and unemploymnet rate among females in the United States with a correlation coefficient (R) of 0.832 and weighted average of 5.6%, a difference of 13.0%.
Female Unemployment Correlation Summary
| Measurement | Immigrants from Bolivia | Guamanian/Chamorro |
| Minimum | 0.67% | 1.0% |
| Maximum | 24.5% | 100.0% |
| Range | 23.8% | 99.0% |
| Mean | 5.5% | 11.7% |
| Median | 4.8% | 5.7% |
| Interquartile 25% (IQ1) | 3.9% | 3.9% |
| Interquartile 75% (IQ3) | 5.7% | 7.4% |
| Interquartile Range (IQR) | 1.8% | 3.5% |
| Standard Deviation (Sample) | 3.4% | 20.3% |
| Standard Deviation (Population) | 3.4% | 19.9% |
Similar Demographics by Female Unemployment
Demographics Similar to Immigrants from Bolivia by Female Unemployment
In terms of female unemployment, the demographic groups most similar to Immigrants from Bolivia are Russian (5.0%, a difference of 0.010%), Immigrants from Singapore (5.0%, a difference of 0.020%), Immigrants from Venezuela (5.0%, a difference of 0.030%), Immigrants from Northern Europe (4.9%, a difference of 0.040%), and German Russian (4.9%, a difference of 0.11%).
| Demographics | Rating | Rank | Female Unemployment |
| Cubans | 98.3 /100 | #67 | Exceptional 4.9% |
| Tlingit-Haida | 98.3 /100 | #68 | Exceptional 4.9% |
| Immigrants | Ireland | 98.2 /100 | #69 | Exceptional 4.9% |
| Osage | 98.2 /100 | #70 | Exceptional 4.9% |
| German Russians | 98.1 /100 | #71 | Exceptional 4.9% |
| Immigrants | Northern Europe | 98.0 /100 | #72 | Exceptional 4.9% |
| Russians | 98.0 /100 | #73 | Exceptional 5.0% |
| Immigrants | Bolivia | 98.0 /100 | #74 | Exceptional 5.0% |
| Immigrants | Singapore | 98.0 /100 | #75 | Exceptional 5.0% |
| Immigrants | Venezuela | 97.9 /100 | #76 | Exceptional 5.0% |
| Mongolians | 97.8 /100 | #77 | Exceptional 5.0% |
| Immigrants | Netherlands | 97.8 /100 | #78 | Exceptional 5.0% |
| Turks | 97.6 /100 | #79 | Exceptional 5.0% |
| New Zealanders | 97.4 /100 | #80 | Exceptional 5.0% |
| Filipinos | 97.3 /100 | #81 | Exceptional 5.0% |
Demographics Similar to Guamanians/Chamorros by Female Unemployment
In terms of female unemployment, the demographic groups most similar to Guamanians/Chamorros are Immigrants from Liberia (5.6%, a difference of 0.14%), Japanese (5.6%, a difference of 0.23%), Immigrants from Western Asia (5.6%, a difference of 0.31%), Cree (5.6%, a difference of 0.47%), and Immigrants from Uzbekistan (5.6%, a difference of 0.51%).
| Demographics | Rating | Rank | Female Unemployment |
| Sierra Leoneans | 3.2 /100 | #238 | Tragic 5.5% |
| Aleuts | 3.0 /100 | #239 | Tragic 5.5% |
| Immigrants | South America | 2.9 /100 | #240 | Tragic 5.5% |
| South American Indians | 2.8 /100 | #241 | Tragic 5.5% |
| Marshallese | 2.3 /100 | #242 | Tragic 5.6% |
| Spanish Americans | 2.2 /100 | #243 | Tragic 5.6% |
| Immigrants | Liberia | 1.5 /100 | #244 | Tragic 5.6% |
| Guamanians/Chamorros | 1.4 /100 | #245 | Tragic 5.6% |
| Japanese | 1.2 /100 | #246 | Tragic 5.6% |
| Immigrants | Western Asia | 1.1 /100 | #247 | Tragic 5.6% |
| Cree | 1.0 /100 | #248 | Tragic 5.6% |
| Immigrants | Uzbekistan | 1.0 /100 | #249 | Tragic 5.6% |
| Immigrants | Syria | 0.8 /100 | #250 | Tragic 5.6% |
| Assyrians/Chaldeans/Syriacs | 0.8 /100 | #251 | Tragic 5.6% |
| Cajuns | 0.7 /100 | #252 | Tragic 5.7% |