Immigrants from Belize vs German Russian Unemployment Among Ages 60 to 64 years
COMPARE
Immigrants from Belize
German Russian
Unemployment Among Ages 60 to 64 years
Unemployment Among Ages 60 to 64 years Comparison
Immigrants from Belize
German Russians
5.7%
UNEMPLOYMENT AMONG AGES 60 TO 64 YEARS
0.0/ 100
METRIC RATING
319th/ 347
METRIC RANK
4.9%
UNEMPLOYMENT AMONG AGES 60 TO 64 YEARS
16.8/ 100
METRIC RATING
208th/ 347
METRIC RANK
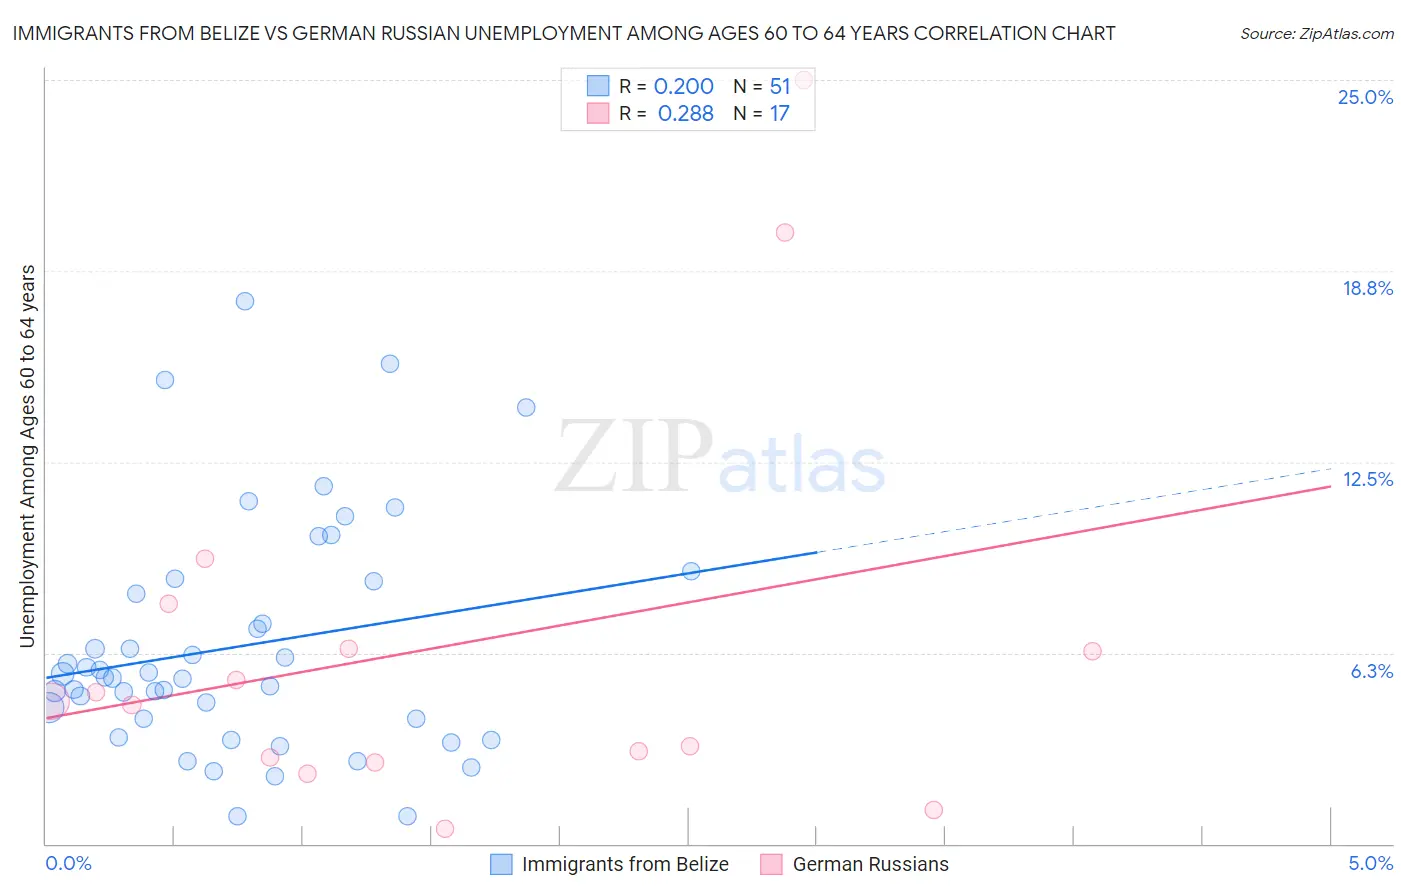
Immigrants from Belize vs German Russian Unemployment Among Ages 60 to 64 years Correlation Chart
The statistical analysis conducted on geographies consisting of 126,159,740 people shows a weak positive correlation between the proportion of Immigrants from Belize and unemployment rate among population between the ages 60 and 64 in the United States with a correlation coefficient (R) of 0.200 and weighted average of 5.7%. Similarly, the statistical analysis conducted on geographies consisting of 92,139,052 people shows a weak positive correlation between the proportion of German Russians and unemployment rate among population between the ages 60 and 64 in the United States with a correlation coefficient (R) of 0.288 and weighted average of 4.9%, a difference of 15.4%.
Unemployment Among Ages 60 to 64 years Correlation Summary
| Measurement | Immigrants from Belize | German Russian |
| Minimum | 0.90% | 0.50% |
| Maximum | 17.8% | 25.0% |
| Range | 16.9% | 24.5% |
| Mean | 6.5% | 6.5% |
| Median | 5.4% | 4.6% |
| Interquartile 25% (IQ1) | 4.1% | 2.7% |
| Interquartile 75% (IQ3) | 8.6% | 7.1% |
| Interquartile Range (IQR) | 4.5% | 4.4% |
| Standard Deviation (Sample) | 3.8% | 6.5% |
| Standard Deviation (Population) | 3.7% | 6.3% |
Similar Demographics by Unemployment Among Ages 60 to 64 years
Demographics Similar to Immigrants from Belize by Unemployment Among Ages 60 to 64 years
In terms of unemployment among ages 60 to 64 years, the demographic groups most similar to Immigrants from Belize are Native/Alaskan (5.7%, a difference of 0.49%), Shoshone (5.7%, a difference of 0.54%), Colville (5.7%, a difference of 0.77%), Dutch West Indian (5.7%, a difference of 0.82%), and Ecuadorian (5.8%, a difference of 1.2%).
| Demographics | Rating | Rank | Unemployment Among Ages 60 to 64 years |
| Immigrants | West Indies | 0.0 /100 | #312 | Tragic 5.5% |
| Belizeans | 0.0 /100 | #313 | Tragic 5.5% |
| Guyanese | 0.0 /100 | #314 | Tragic 5.5% |
| Cree | 0.0 /100 | #315 | Tragic 5.6% |
| Cheyenne | 0.0 /100 | #316 | Tragic 5.6% |
| Shoshone | 0.0 /100 | #317 | Tragic 5.7% |
| Natives/Alaskans | 0.0 /100 | #318 | Tragic 5.7% |
| Immigrants | Belize | 0.0 /100 | #319 | Tragic 5.7% |
| Colville | 0.0 /100 | #320 | Tragic 5.7% |
| Dutch West Indians | 0.0 /100 | #321 | Tragic 5.7% |
| Ecuadorians | 0.0 /100 | #322 | Tragic 5.8% |
| Alsatians | 0.0 /100 | #323 | Tragic 5.8% |
| Immigrants | Ecuador | 0.0 /100 | #324 | Tragic 5.8% |
| Paiute | 0.0 /100 | #325 | Tragic 5.8% |
| Immigrants | St. Vincent and the Grenadines | 0.0 /100 | #326 | Tragic 5.9% |
Demographics Similar to German Russians by Unemployment Among Ages 60 to 64 years
In terms of unemployment among ages 60 to 64 years, the demographic groups most similar to German Russians are Sierra Leonean (4.9%, a difference of 0.010%), Chippewa (4.9%, a difference of 0.030%), Immigrants from Indonesia (4.9%, a difference of 0.040%), New Zealander (4.9%, a difference of 0.040%), and Cherokee (4.9%, a difference of 0.040%).
| Demographics | Rating | Rank | Unemployment Among Ages 60 to 64 years |
| Colombians | 22.7 /100 | #201 | Fair 4.9% |
| Immigrants | Western Africa | 20.6 /100 | #202 | Fair 4.9% |
| Uruguayans | 19.9 /100 | #203 | Poor 4.9% |
| Russians | 18.9 /100 | #204 | Poor 4.9% |
| Immigrants | Indonesia | 17.4 /100 | #205 | Poor 4.9% |
| New Zealanders | 17.4 /100 | #206 | Poor 4.9% |
| Chippewa | 17.3 /100 | #207 | Poor 4.9% |
| German Russians | 16.8 /100 | #208 | Poor 4.9% |
| Sierra Leoneans | 16.5 /100 | #209 | Poor 4.9% |
| Cherokee | 16.1 /100 | #210 | Poor 4.9% |
| Blackfeet | 15.7 /100 | #211 | Poor 4.9% |
| Moroccans | 15.0 /100 | #212 | Poor 4.9% |
| Eastern Europeans | 14.3 /100 | #213 | Poor 4.9% |
| Immigrants | Russia | 13.7 /100 | #214 | Poor 4.9% |
| Immigrants | South Eastern Asia | 13.1 /100 | #215 | Poor 4.9% |