Immigrants from Belize vs Carpatho Rusyn Unemployment Among Women with Children Under 18 years
COMPARE
Immigrants from Belize
Carpatho Rusyn
Unemployment Among Women with Children Under 18 years
Unemployment Among Women with Children Under 18 years Comparison
Immigrants from Belize
Carpatho Rusyns
6.7%
UNEMPLOYMENT AMONG WOMEN WITH CHILDREN UNDER 18 YEARS
0.0/ 100
METRIC RATING
320th/ 347
METRIC RANK
5.4%
UNEMPLOYMENT AMONG WOMEN WITH CHILDREN UNDER 18 YEARS
70.8/ 100
METRIC RATING
153rd/ 347
METRIC RANK
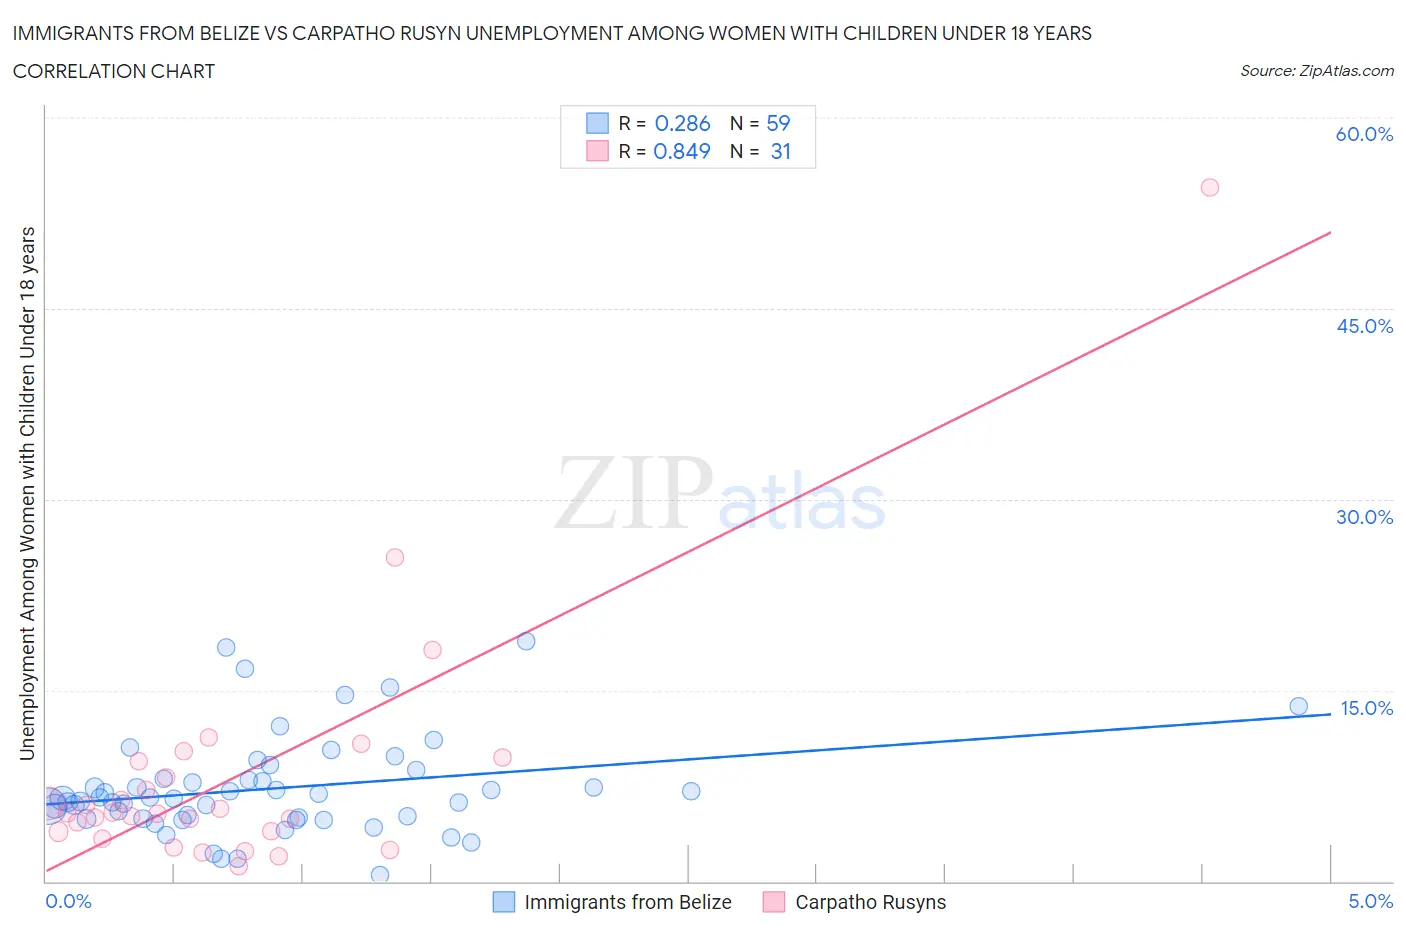
Immigrants from Belize vs Carpatho Rusyn Unemployment Among Women with Children Under 18 years Correlation Chart
The statistical analysis conducted on geographies consisting of 128,888,492 people shows a weak positive correlation between the proportion of Immigrants from Belize and unemployment rate among women with children under the age of 18 in the United States with a correlation coefficient (R) of 0.286 and weighted average of 6.7%. Similarly, the statistical analysis conducted on geographies consisting of 58,081,192 people shows a very strong positive correlation between the proportion of Carpatho Rusyns and unemployment rate among women with children under the age of 18 in the United States with a correlation coefficient (R) of 0.849 and weighted average of 5.4%, a difference of 24.6%.
Unemployment Among Women with Children Under 18 years Correlation Summary
| Measurement | Immigrants from Belize | Carpatho Rusyn |
| Minimum | 0.50% | 1.2% |
| Maximum | 18.9% | 54.5% |
| Range | 18.4% | 53.3% |
| Mean | 7.3% | 8.2% |
| Median | 6.5% | 5.4% |
| Interquartile 25% (IQ1) | 4.9% | 3.9% |
| Interquartile 75% (IQ3) | 8.1% | 9.5% |
| Interquartile Range (IQR) | 3.2% | 5.6% |
| Standard Deviation (Sample) | 3.8% | 9.9% |
| Standard Deviation (Population) | 3.8% | 9.7% |
Similar Demographics by Unemployment Among Women with Children Under 18 years
Demographics Similar to Immigrants from Belize by Unemployment Among Women with Children Under 18 years
In terms of unemployment among women with children under 18 years, the demographic groups most similar to Immigrants from Belize are U.S. Virgin Islander (6.7%, a difference of 0.050%), Central American Indian (6.7%, a difference of 0.090%), Alaska Native (6.7%, a difference of 0.33%), Shoshone (6.6%, a difference of 0.62%), and Immigrants from Ecuador (6.6%, a difference of 0.66%).
| Demographics | Rating | Rank | Unemployment Among Women with Children Under 18 years |
| Hispanics or Latinos | 0.0 /100 | #313 | Tragic 6.6% |
| British West Indians | 0.0 /100 | #314 | Tragic 6.6% |
| Immigrants | West Indies | 0.0 /100 | #315 | Tragic 6.6% |
| Immigrants | Ecuador | 0.0 /100 | #316 | Tragic 6.6% |
| Shoshone | 0.0 /100 | #317 | Tragic 6.6% |
| Alaska Natives | 0.0 /100 | #318 | Tragic 6.7% |
| Central American Indians | 0.0 /100 | #319 | Tragic 6.7% |
| Immigrants | Belize | 0.0 /100 | #320 | Tragic 6.7% |
| U.S. Virgin Islanders | 0.0 /100 | #321 | Tragic 6.7% |
| Houma | 0.0 /100 | #322 | Tragic 6.8% |
| Pueblo | 0.0 /100 | #323 | Tragic 6.8% |
| Paiute | 0.0 /100 | #324 | Tragic 6.9% |
| Immigrants | Dominica | 0.0 /100 | #325 | Tragic 7.0% |
| Chippewa | 0.0 /100 | #326 | Tragic 7.0% |
| Lumbee | 0.0 /100 | #327 | Tragic 7.1% |
Demographics Similar to Carpatho Rusyns by Unemployment Among Women with Children Under 18 years
In terms of unemployment among women with children under 18 years, the demographic groups most similar to Carpatho Rusyns are Immigrants from Latvia (5.4%, a difference of 0.0%), Immigrants from South Eastern Asia (5.4%, a difference of 0.020%), Immigrants from Iran (5.4%, a difference of 0.030%), Korean (5.4%, a difference of 0.030%), and South African (5.4%, a difference of 0.050%).
| Demographics | Rating | Rank | Unemployment Among Women with Children Under 18 years |
| Immigrants | Belarus | 73.4 /100 | #146 | Good 5.3% |
| Bangladeshis | 73.2 /100 | #147 | Good 5.3% |
| Immigrants | Western Europe | 72.8 /100 | #148 | Good 5.4% |
| Immigrants | Kenya | 72.2 /100 | #149 | Good 5.4% |
| Immigrants | Argentina | 71.7 /100 | #150 | Good 5.4% |
| Immigrants | Iran | 71.1 /100 | #151 | Good 5.4% |
| Immigrants | South Eastern Asia | 71.1 /100 | #152 | Good 5.4% |
| Carpatho Rusyns | 70.8 /100 | #153 | Good 5.4% |
| Immigrants | Latvia | 70.8 /100 | #154 | Good 5.4% |
| Koreans | 70.5 /100 | #155 | Good 5.4% |
| South Africans | 70.3 /100 | #156 | Good 5.4% |
| German Russians | 70.2 /100 | #157 | Good 5.4% |
| Immigrants | Burma/Myanmar | 69.5 /100 | #158 | Good 5.4% |
| Chickasaw | 68.4 /100 | #159 | Good 5.4% |
| Afghans | 66.6 /100 | #160 | Good 5.4% |