Immigrants from Belize vs Immigrants from Yemen Unemployment Among Women with Children Under 18 years
COMPARE
Immigrants from Belize
Immigrants from Yemen
Unemployment Among Women with Children Under 18 years
Unemployment Among Women with Children Under 18 years Comparison
Immigrants from Belize
Immigrants from Yemen
6.7%
UNEMPLOYMENT AMONG WOMEN WITH CHILDREN UNDER 18 YEARS
0.0/ 100
METRIC RATING
320th/ 347
METRIC RANK
8.2%
UNEMPLOYMENT AMONG WOMEN WITH CHILDREN UNDER 18 YEARS
0.0/ 100
METRIC RATING
338th/ 347
METRIC RANK
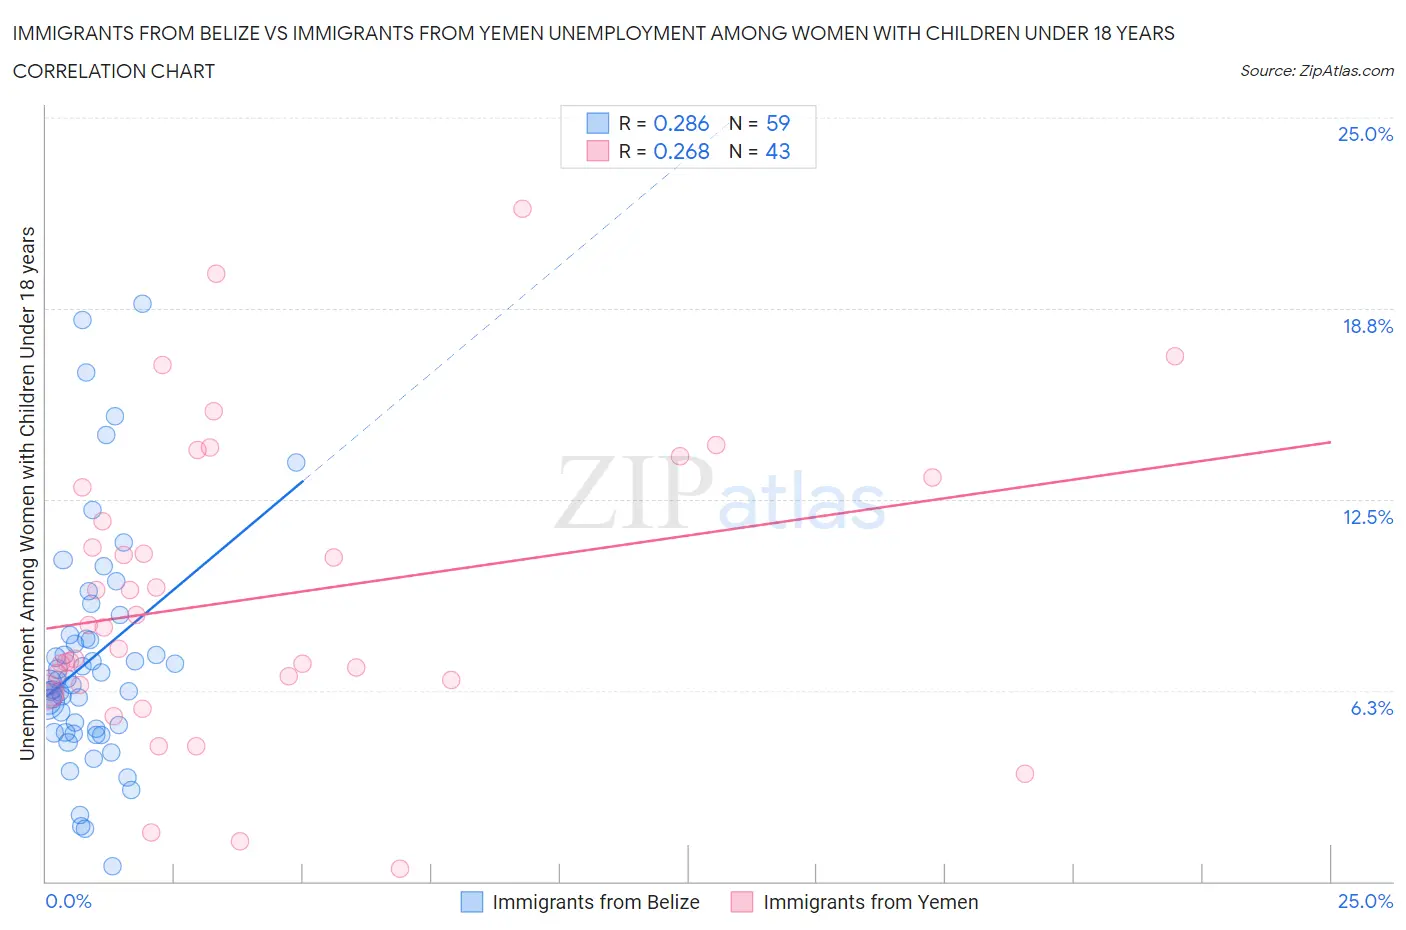
Immigrants from Belize vs Immigrants from Yemen Unemployment Among Women with Children Under 18 years Correlation Chart
The statistical analysis conducted on geographies consisting of 128,888,492 people shows a weak positive correlation between the proportion of Immigrants from Belize and unemployment rate among women with children under the age of 18 in the United States with a correlation coefficient (R) of 0.286 and weighted average of 6.7%. Similarly, the statistical analysis conducted on geographies consisting of 82,082,671 people shows a weak positive correlation between the proportion of Immigrants from Yemen and unemployment rate among women with children under the age of 18 in the United States with a correlation coefficient (R) of 0.268 and weighted average of 8.2%, a difference of 22.6%.
Unemployment Among Women with Children Under 18 years Correlation Summary
| Measurement | Immigrants from Belize | Immigrants from Yemen |
| Minimum | 0.50% | 0.40% |
| Maximum | 18.9% | 22.0% |
| Range | 18.4% | 21.6% |
| Mean | 7.3% | 9.3% |
| Median | 6.5% | 8.3% |
| Interquartile 25% (IQ1) | 4.9% | 6.4% |
| Interquartile 75% (IQ3) | 8.1% | 12.9% |
| Interquartile Range (IQR) | 3.2% | 6.5% |
| Standard Deviation (Sample) | 3.8% | 4.8% |
| Standard Deviation (Population) | 3.8% | 4.7% |
Demographics Similar to Immigrants from Belize and Immigrants from Yemen by Unemployment Among Women with Children Under 18 years
In terms of unemployment among women with children under 18 years, the demographic groups most similar to Immigrants from Belize are U.S. Virgin Islander (6.7%, a difference of 0.050%), Central American Indian (6.7%, a difference of 0.090%), Houma (6.8%, a difference of 2.0%), Pueblo (6.8%, a difference of 2.2%), and Paiute (6.9%, a difference of 3.2%). Similarly, the demographic groups most similar to Immigrants from Yemen are Navajo (8.2%, a difference of 0.52%), Yakama (8.1%, a difference of 1.6%), Sioux (7.9%, a difference of 3.1%), Apache (7.9%, a difference of 3.4%), and Cheyenne (7.8%, a difference of 4.4%).
| Demographics | Rating | Rank | Unemployment Among Women with Children Under 18 years |
| Central American Indians | 0.0 /100 | #319 | Tragic 6.7% |
| Immigrants | Belize | 0.0 /100 | #320 | Tragic 6.7% |
| U.S. Virgin Islanders | 0.0 /100 | #321 | Tragic 6.7% |
| Houma | 0.0 /100 | #322 | Tragic 6.8% |
| Pueblo | 0.0 /100 | #323 | Tragic 6.8% |
| Paiute | 0.0 /100 | #324 | Tragic 6.9% |
| Immigrants | Dominica | 0.0 /100 | #325 | Tragic 7.0% |
| Chippewa | 0.0 /100 | #326 | Tragic 7.0% |
| Lumbee | 0.0 /100 | #327 | Tragic 7.1% |
| Natives/Alaskans | 0.0 /100 | #328 | Tragic 7.2% |
| Blacks/African Americans | 0.0 /100 | #329 | Tragic 7.3% |
| Colville | 0.0 /100 | #330 | Tragic 7.4% |
| Hopi | 0.0 /100 | #331 | Tragic 7.4% |
| Dominicans | 0.0 /100 | #332 | Tragic 7.5% |
| Immigrants | Dominican Republic | 0.0 /100 | #333 | Tragic 7.5% |
| Cheyenne | 0.0 /100 | #334 | Tragic 7.8% |
| Apache | 0.0 /100 | #335 | Tragic 7.9% |
| Sioux | 0.0 /100 | #336 | Tragic 7.9% |
| Yakama | 0.0 /100 | #337 | Tragic 8.1% |
| Immigrants | Yemen | 0.0 /100 | #338 | Tragic 8.2% |
| Navajo | 0.0 /100 | #339 | Tragic 8.2% |