Immigrants from Belgium vs Czechoslovakian Unemployment Among Women with Children Under 18 years
COMPARE
Immigrants from Belgium
Czechoslovakian
Unemployment Among Women with Children Under 18 years
Unemployment Among Women with Children Under 18 years Comparison
Immigrants from Belgium
Czechoslovakians
5.1%
UNEMPLOYMENT AMONG WOMEN WITH CHILDREN UNDER 18 YEARS
97.9/ 100
METRIC RATING
58th/ 347
METRIC RANK
5.1%
UNEMPLOYMENT AMONG WOMEN WITH CHILDREN UNDER 18 YEARS
98.0/ 100
METRIC RATING
57th/ 347
METRIC RANK
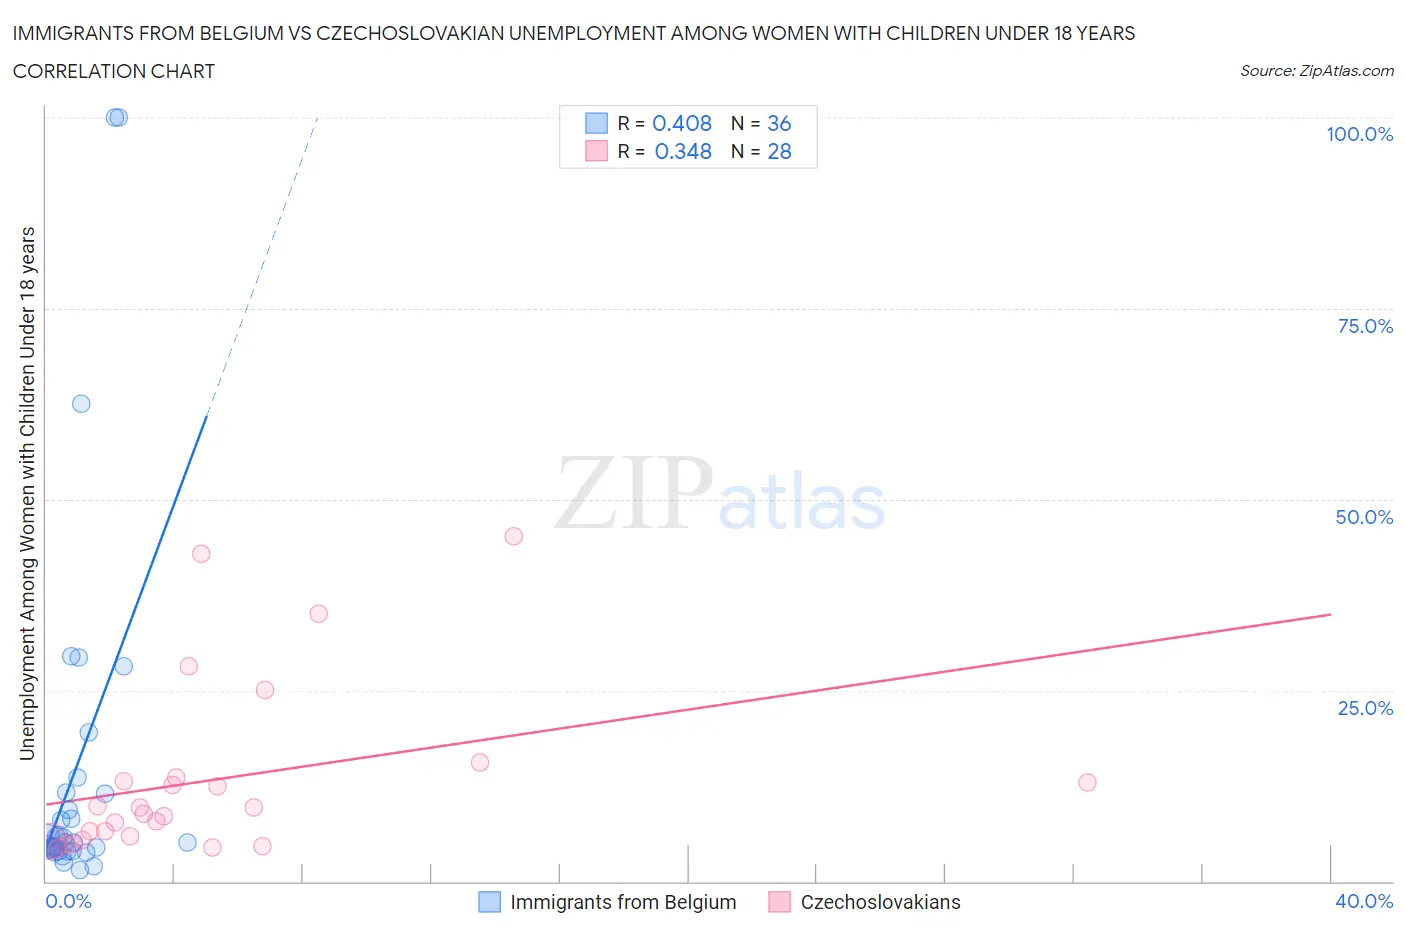
Immigrants from Belgium vs Czechoslovakian Unemployment Among Women with Children Under 18 years Correlation Chart
The statistical analysis conducted on geographies consisting of 143,933,405 people shows a moderate positive correlation between the proportion of Immigrants from Belgium and unemployment rate among women with children under the age of 18 in the United States with a correlation coefficient (R) of 0.408 and weighted average of 5.1%. Similarly, the statistical analysis conducted on geographies consisting of 349,944,038 people shows a mild positive correlation between the proportion of Czechoslovakians and unemployment rate among women with children under the age of 18 in the United States with a correlation coefficient (R) of 0.348 and weighted average of 5.1%, a difference of 0.080%.
Unemployment Among Women with Children Under 18 years Correlation Summary
| Measurement | Immigrants from Belgium | Czechoslovakian |
| Minimum | 1.5% | 4.3% |
| Maximum | 100.0% | 45.2% |
| Range | 98.5% | 40.9% |
| Mean | 14.7% | 13.3% |
| Median | 5.1% | 9.3% |
| Interquartile 25% (IQ1) | 4.1% | 5.7% |
| Interquartile 75% (IQ3) | 11.5% | 13.3% |
| Interquartile Range (IQR) | 7.4% | 7.6% |
| Standard Deviation (Sample) | 24.0% | 11.4% |
| Standard Deviation (Population) | 23.7% | 11.2% |
Demographics Similar to Immigrants from Belgium and Czechoslovakians by Unemployment Among Women with Children Under 18 years
In terms of unemployment among women with children under 18 years, the demographic groups most similar to Immigrants from Belgium are Asian (5.1%, a difference of 0.020%), Immigrants from Ireland (5.1%, a difference of 0.14%), Welsh (5.1%, a difference of 0.17%), Immigrants from Sri Lanka (5.1%, a difference of 0.18%), and Immigrants from Serbia (5.1%, a difference of 0.31%). Similarly, the demographic groups most similar to Czechoslovakians are Immigrants from Ireland (5.1%, a difference of 0.050%), Immigrants from Sri Lanka (5.1%, a difference of 0.090%), Asian (5.1%, a difference of 0.10%), Immigrants from Serbia (5.1%, a difference of 0.23%), and Scottish (5.1%, a difference of 0.25%).
| Demographics | Rating | Rank | Unemployment Among Women with Children Under 18 years |
| British | 98.7 /100 | #47 | Exceptional 5.0% |
| Northern Europeans | 98.6 /100 | #48 | Exceptional 5.0% |
| Lithuanians | 98.4 /100 | #49 | Exceptional 5.0% |
| Immigrants | Japan | 98.4 /100 | #50 | Exceptional 5.0% |
| Yugoslavians | 98.3 /100 | #51 | Exceptional 5.1% |
| Immigrants | Nepal | 98.3 /100 | #52 | Exceptional 5.1% |
| Scottish | 98.2 /100 | #53 | Exceptional 5.1% |
| Immigrants | Serbia | 98.2 /100 | #54 | Exceptional 5.1% |
| Immigrants | Sri Lanka | 98.1 /100 | #55 | Exceptional 5.1% |
| Immigrants | Ireland | 98.0 /100 | #56 | Exceptional 5.1% |
| Czechoslovakians | 98.0 /100 | #57 | Exceptional 5.1% |
| Immigrants | Belgium | 97.9 /100 | #58 | Exceptional 5.1% |
| Asians | 97.9 /100 | #59 | Exceptional 5.1% |
| Welsh | 97.7 /100 | #60 | Exceptional 5.1% |
| Russians | 97.5 /100 | #61 | Exceptional 5.1% |
| Immigrants | Bulgaria | 97.4 /100 | #62 | Exceptional 5.1% |
| Italians | 97.4 /100 | #63 | Exceptional 5.1% |
| Estonians | 97.2 /100 | #64 | Exceptional 5.1% |
| Immigrants | Sweden | 97.1 /100 | #65 | Exceptional 5.1% |
| Immigrants | Australia | 97.0 /100 | #66 | Exceptional 5.1% |
| Fijians | 96.9 /100 | #67 | Exceptional 5.1% |