Immigrants from Belgium vs Immigrants from Bulgaria Unemployment Among Women with Children Under 18 years
COMPARE
Immigrants from Belgium
Immigrants from Bulgaria
Unemployment Among Women with Children Under 18 years
Unemployment Among Women with Children Under 18 years Comparison
Immigrants from Belgium
Immigrants from Bulgaria
5.1%
UNEMPLOYMENT AMONG WOMEN WITH CHILDREN UNDER 18 YEARS
97.9/ 100
METRIC RATING
58th/ 347
METRIC RANK
5.1%
UNEMPLOYMENT AMONG WOMEN WITH CHILDREN UNDER 18 YEARS
97.4/ 100
METRIC RATING
62nd/ 347
METRIC RANK
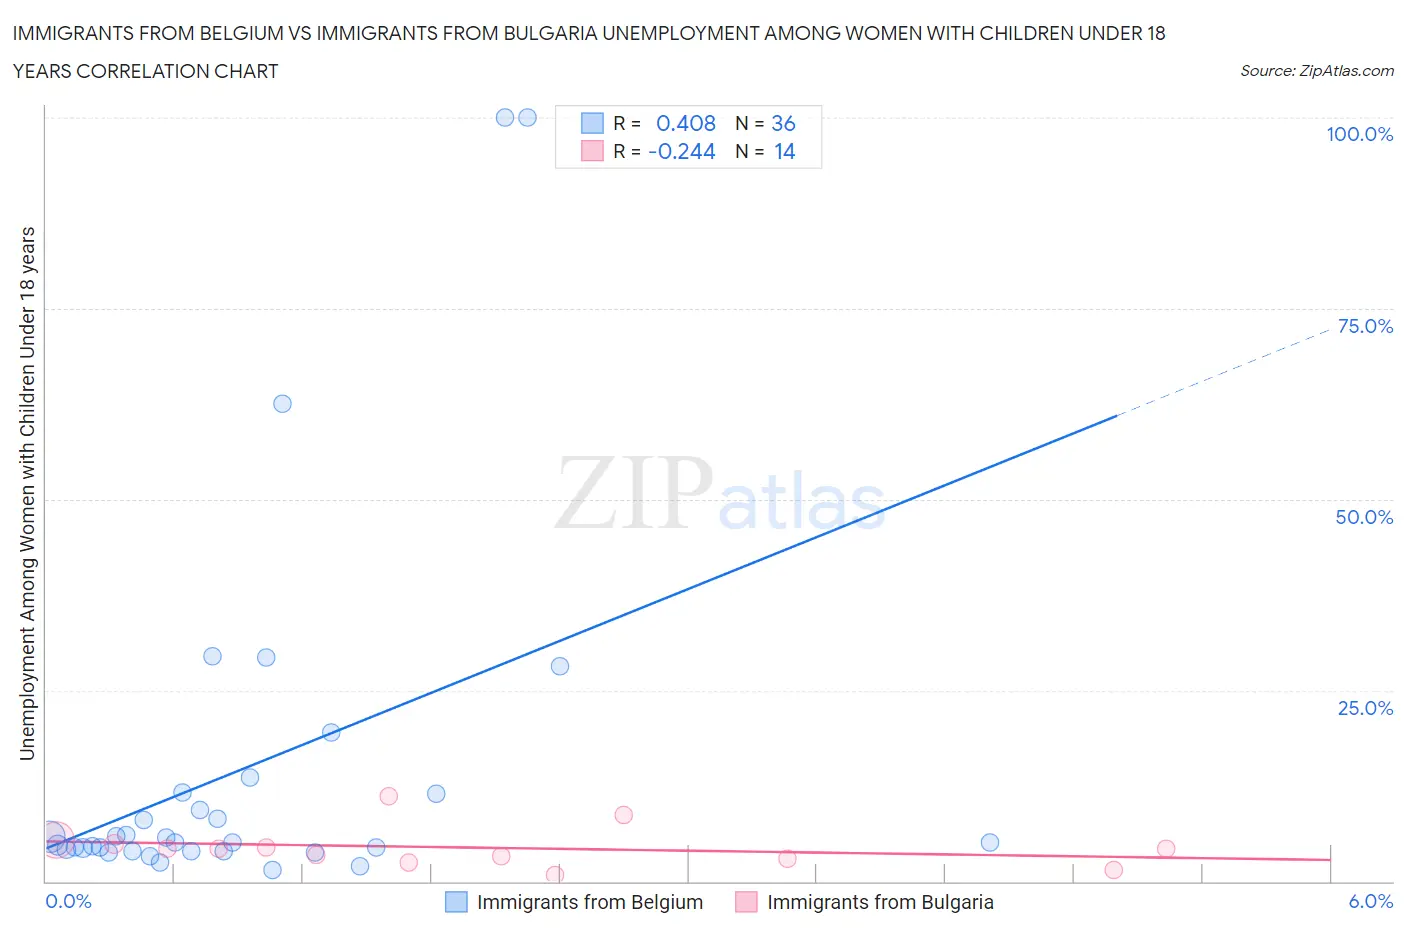
Immigrants from Belgium vs Immigrants from Bulgaria Unemployment Among Women with Children Under 18 years Correlation Chart
The statistical analysis conducted on geographies consisting of 143,933,405 people shows a moderate positive correlation between the proportion of Immigrants from Belgium and unemployment rate among women with children under the age of 18 in the United States with a correlation coefficient (R) of 0.408 and weighted average of 5.1%. Similarly, the statistical analysis conducted on geographies consisting of 169,651,833 people shows a weak negative correlation between the proportion of Immigrants from Bulgaria and unemployment rate among women with children under the age of 18 in the United States with a correlation coefficient (R) of -0.244 and weighted average of 5.1%, a difference of 0.39%.
Unemployment Among Women with Children Under 18 years Correlation Summary
| Measurement | Immigrants from Belgium | Immigrants from Bulgaria |
| Minimum | 1.5% | 0.80% |
| Maximum | 100.0% | 11.2% |
| Range | 98.5% | 10.4% |
| Mean | 14.7% | 4.4% |
| Median | 5.1% | 4.2% |
| Interquartile 25% (IQ1) | 4.1% | 2.9% |
| Interquartile 75% (IQ3) | 11.5% | 4.8% |
| Interquartile Range (IQR) | 7.4% | 1.9% |
| Standard Deviation (Sample) | 24.0% | 2.7% |
| Standard Deviation (Population) | 23.7% | 2.6% |
Demographics Similar to Immigrants from Belgium and Immigrants from Bulgaria by Unemployment Among Women with Children Under 18 years
In terms of unemployment among women with children under 18 years, the demographic groups most similar to Immigrants from Belgium are Asian (5.1%, a difference of 0.020%), Czechoslovakian (5.1%, a difference of 0.080%), Immigrants from Ireland (5.1%, a difference of 0.14%), Welsh (5.1%, a difference of 0.17%), and Immigrants from Sri Lanka (5.1%, a difference of 0.18%). Similarly, the demographic groups most similar to Immigrants from Bulgaria are Italian (5.1%, a difference of 0.010%), Russian (5.1%, a difference of 0.070%), Estonian (5.1%, a difference of 0.19%), Immigrants from Sweden (5.1%, a difference of 0.21%), and Welsh (5.1%, a difference of 0.22%).
| Demographics | Rating | Rank | Unemployment Among Women with Children Under 18 years |
| Immigrants | Japan | 98.4 /100 | #50 | Exceptional 5.0% |
| Yugoslavians | 98.3 /100 | #51 | Exceptional 5.1% |
| Immigrants | Nepal | 98.3 /100 | #52 | Exceptional 5.1% |
| Scottish | 98.2 /100 | #53 | Exceptional 5.1% |
| Immigrants | Serbia | 98.2 /100 | #54 | Exceptional 5.1% |
| Immigrants | Sri Lanka | 98.1 /100 | #55 | Exceptional 5.1% |
| Immigrants | Ireland | 98.0 /100 | #56 | Exceptional 5.1% |
| Czechoslovakians | 98.0 /100 | #57 | Exceptional 5.1% |
| Immigrants | Belgium | 97.9 /100 | #58 | Exceptional 5.1% |
| Asians | 97.9 /100 | #59 | Exceptional 5.1% |
| Welsh | 97.7 /100 | #60 | Exceptional 5.1% |
| Russians | 97.5 /100 | #61 | Exceptional 5.1% |
| Immigrants | Bulgaria | 97.4 /100 | #62 | Exceptional 5.1% |
| Italians | 97.4 /100 | #63 | Exceptional 5.1% |
| Estonians | 97.2 /100 | #64 | Exceptional 5.1% |
| Immigrants | Sweden | 97.1 /100 | #65 | Exceptional 5.1% |
| Immigrants | Australia | 97.0 /100 | #66 | Exceptional 5.1% |
| Fijians | 96.9 /100 | #67 | Exceptional 5.1% |
| Irish | 96.8 /100 | #68 | Exceptional 5.1% |
| Austrians | 96.6 /100 | #69 | Exceptional 5.1% |
| Icelanders | 96.6 /100 | #70 | Exceptional 5.1% |