Palestinian vs Afghan Unemployment Among Women with Children Under 6 years
COMPARE
Palestinian
Afghan
Unemployment Among Women with Children Under 6 years
Unemployment Among Women with Children Under 6 years Comparison
Palestinians
Afghans
7.2%
UNEMPLOYMENT AMONG WOMEN WITH CHILDREN UNDER 6 YEARS
96.8/ 100
METRIC RATING
110th/ 347
METRIC RANK
7.0%
UNEMPLOYMENT AMONG WOMEN WITH CHILDREN UNDER 6 YEARS
99.4/ 100
METRIC RATING
71st/ 347
METRIC RANK
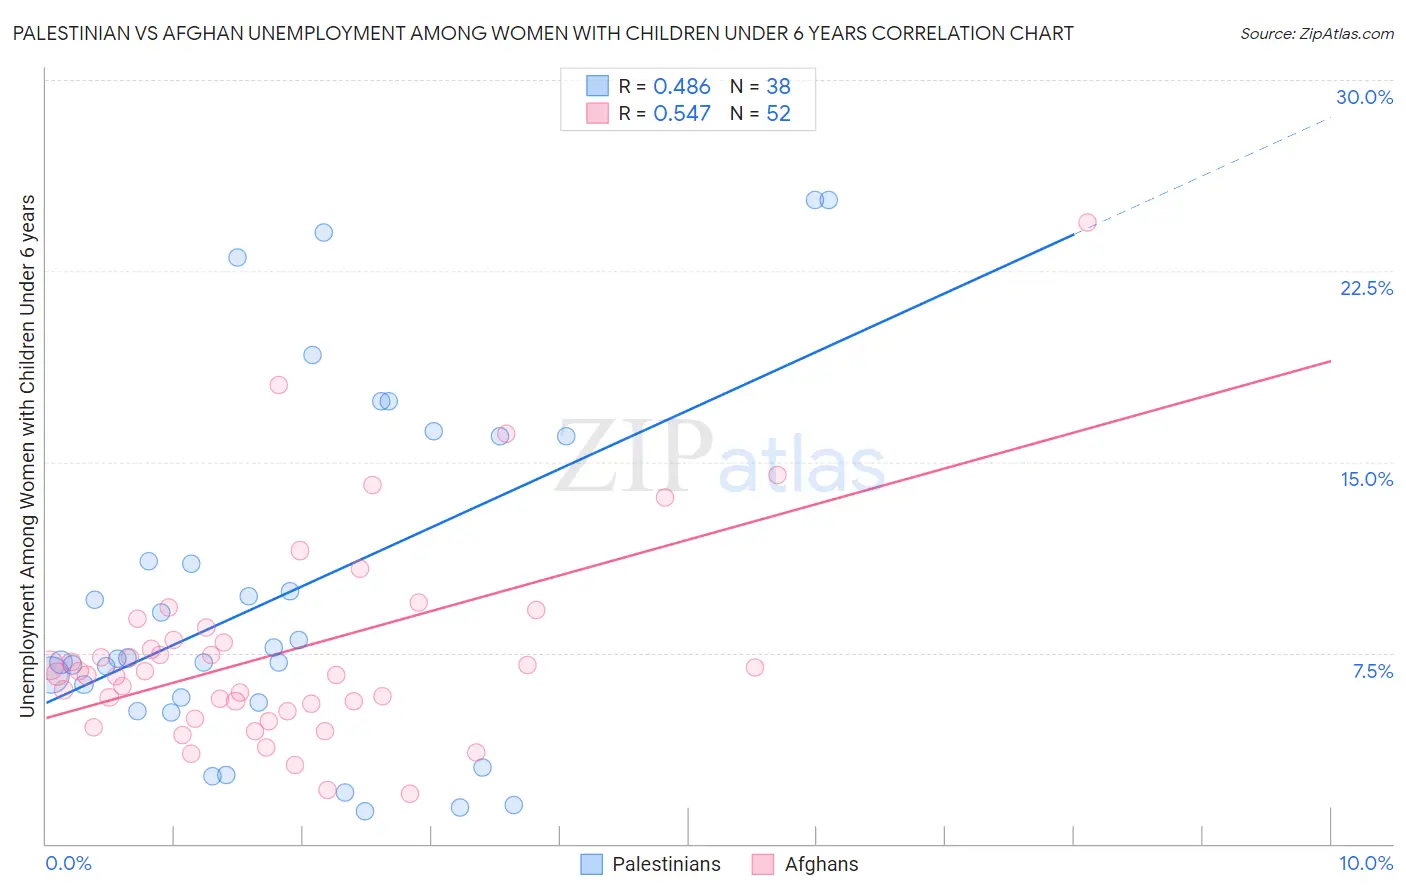
Palestinian vs Afghan Unemployment Among Women with Children Under 6 years Correlation Chart
The statistical analysis conducted on geographies consisting of 183,414,881 people shows a moderate positive correlation between the proportion of Palestinians and unemployment rate among women with children under the age of 6 in the United States with a correlation coefficient (R) of 0.486 and weighted average of 7.2%. Similarly, the statistical analysis conducted on geographies consisting of 133,713,490 people shows a substantial positive correlation between the proportion of Afghans and unemployment rate among women with children under the age of 6 in the United States with a correlation coefficient (R) of 0.547 and weighted average of 7.0%, a difference of 3.1%.
Unemployment Among Women with Children Under 6 years Correlation Summary
| Measurement | Palestinian | Afghan |
| Minimum | 1.3% | 2.0% |
| Maximum | 25.3% | 24.4% |
| Range | 24.0% | 22.4% |
| Mean | 9.9% | 7.5% |
| Median | 7.3% | 6.7% |
| Interquartile 25% (IQ1) | 5.5% | 5.3% |
| Interquartile 75% (IQ3) | 16.0% | 8.3% |
| Interquartile Range (IQR) | 10.5% | 2.9% |
| Standard Deviation (Sample) | 6.9% | 4.1% |
| Standard Deviation (Population) | 6.8% | 4.1% |
Similar Demographics by Unemployment Among Women with Children Under 6 years
Demographics Similar to Palestinians by Unemployment Among Women with Children Under 6 years
In terms of unemployment among women with children under 6 years, the demographic groups most similar to Palestinians are Norwegian (7.2%, a difference of 0.060%), Australian (7.2%, a difference of 0.070%), Eastern European (7.2%, a difference of 0.080%), Israeli (7.2%, a difference of 0.17%), and Immigrants from Kazakhstan (7.2%, a difference of 0.20%).
| Demographics | Rating | Rank | Unemployment Among Women with Children Under 6 years |
| Immigrants | Saudi Arabia | 97.3 /100 | #103 | Exceptional 7.2% |
| Immigrants | Egypt | 97.2 /100 | #104 | Exceptional 7.2% |
| Venezuelans | 97.2 /100 | #105 | Exceptional 7.2% |
| Immigrants | Pakistan | 97.2 /100 | #106 | Exceptional 7.2% |
| Immigrants | Kazakhstan | 97.1 /100 | #107 | Exceptional 7.2% |
| Eastern Europeans | 96.9 /100 | #108 | Exceptional 7.2% |
| Australians | 96.9 /100 | #109 | Exceptional 7.2% |
| Palestinians | 96.8 /100 | #110 | Exceptional 7.2% |
| Norwegians | 96.7 /100 | #111 | Exceptional 7.2% |
| Israelis | 96.5 /100 | #112 | Exceptional 7.2% |
| Nicaraguans | 96.3 /100 | #113 | Exceptional 7.2% |
| Argentineans | 96.2 /100 | #114 | Exceptional 7.2% |
| Immigrants | Italy | 96.1 /100 | #115 | Exceptional 7.2% |
| Armenians | 95.9 /100 | #116 | Exceptional 7.2% |
| Immigrants | Kenya | 95.4 /100 | #117 | Exceptional 7.3% |
Demographics Similar to Afghans by Unemployment Among Women with Children Under 6 years
In terms of unemployment among women with children under 6 years, the demographic groups most similar to Afghans are Immigrants from Iraq (7.0%, a difference of 0.020%), Immigrants from Eritrea (7.0%, a difference of 0.040%), Paraguayan (7.0%, a difference of 0.070%), Cuban (7.0%, a difference of 0.11%), and Immigrants from Netherlands (7.0%, a difference of 0.30%).
| Demographics | Rating | Rank | Unemployment Among Women with Children Under 6 years |
| Tongans | 99.7 /100 | #64 | Exceptional 6.9% |
| Immigrants | Kuwait | 99.7 /100 | #65 | Exceptional 6.9% |
| Immigrants | Belgium | 99.6 /100 | #66 | Exceptional 6.9% |
| Immigrants | Netherlands | 99.5 /100 | #67 | Exceptional 7.0% |
| Paraguayans | 99.4 /100 | #68 | Exceptional 7.0% |
| Immigrants | Eritrea | 99.4 /100 | #69 | Exceptional 7.0% |
| Immigrants | Iraq | 99.4 /100 | #70 | Exceptional 7.0% |
| Afghans | 99.4 /100 | #71 | Exceptional 7.0% |
| Cubans | 99.4 /100 | #72 | Exceptional 7.0% |
| Immigrants | Czechoslovakia | 99.2 /100 | #73 | Exceptional 7.0% |
| Turks | 99.2 /100 | #74 | Exceptional 7.0% |
| Immigrants | Eastern Europe | 99.0 /100 | #75 | Exceptional 7.1% |
| Estonians | 99.0 /100 | #76 | Exceptional 7.1% |
| Immigrants | Croatia | 98.9 /100 | #77 | Exceptional 7.1% |
| Immigrants | Somalia | 98.9 /100 | #78 | Exceptional 7.1% |