Mexican vs Afghan Unemployment Among Women with Children Under 6 years
COMPARE
Mexican
Afghan
Unemployment Among Women with Children Under 6 years
Unemployment Among Women with Children Under 6 years Comparison
Mexicans
Afghans
8.9%
UNEMPLOYMENT AMONG WOMEN WITH CHILDREN UNDER 6 YEARS
0.0/ 100
METRIC RATING
297th/ 347
METRIC RANK
7.0%
UNEMPLOYMENT AMONG WOMEN WITH CHILDREN UNDER 6 YEARS
99.4/ 100
METRIC RATING
71st/ 347
METRIC RANK
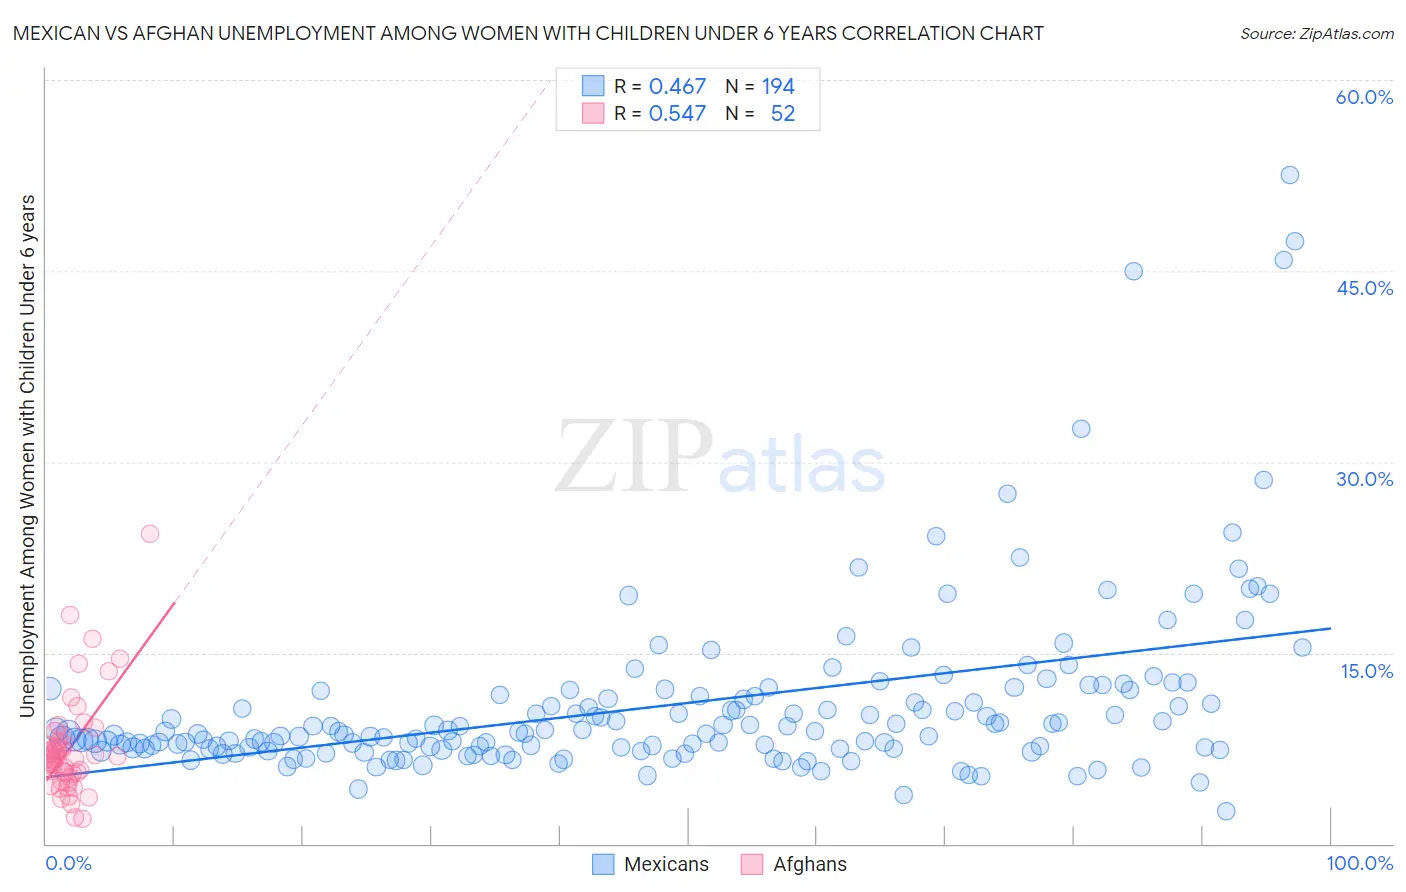
Mexican vs Afghan Unemployment Among Women with Children Under 6 years Correlation Chart
The statistical analysis conducted on geographies consisting of 378,149,944 people shows a moderate positive correlation between the proportion of Mexicans and unemployment rate among women with children under the age of 6 in the United States with a correlation coefficient (R) of 0.467 and weighted average of 8.9%. Similarly, the statistical analysis conducted on geographies consisting of 133,713,490 people shows a substantial positive correlation between the proportion of Afghans and unemployment rate among women with children under the age of 6 in the United States with a correlation coefficient (R) of 0.547 and weighted average of 7.0%, a difference of 26.9%.
Unemployment Among Women with Children Under 6 years Correlation Summary
| Measurement | Mexican | Afghan |
| Minimum | 2.6% | 2.0% |
| Maximum | 52.5% | 24.4% |
| Range | 49.9% | 22.4% |
| Mean | 10.9% | 7.5% |
| Median | 8.7% | 6.7% |
| Interquartile 25% (IQ1) | 7.5% | 5.3% |
| Interquartile 75% (IQ3) | 11.6% | 8.3% |
| Interquartile Range (IQR) | 4.1% | 2.9% |
| Standard Deviation (Sample) | 7.1% | 4.1% |
| Standard Deviation (Population) | 7.0% | 4.1% |
Similar Demographics by Unemployment Among Women with Children Under 6 years
Demographics Similar to Mexicans by Unemployment Among Women with Children Under 6 years
In terms of unemployment among women with children under 6 years, the demographic groups most similar to Mexicans are Immigrants from Dominican Republic (8.9%, a difference of 0.10%), Tlingit-Haida (8.9%, a difference of 0.16%), Immigrants from Central America (8.9%, a difference of 0.23%), Nonimmigrants (8.8%, a difference of 0.27%), and Immigrants from Jamaica (8.9%, a difference of 0.37%).
| Demographics | Rating | Rank | Unemployment Among Women with Children Under 6 years |
| Vietnamese | 0.0 /100 | #290 | Tragic 8.8% |
| Jamaicans | 0.0 /100 | #291 | Tragic 8.8% |
| Cheyenne | 0.0 /100 | #292 | Tragic 8.8% |
| Immigrants | Bangladesh | 0.0 /100 | #293 | Tragic 8.8% |
| Immigrants | Nonimmigrants | 0.0 /100 | #294 | Tragic 8.8% |
| Immigrants | Central America | 0.0 /100 | #295 | Tragic 8.9% |
| Immigrants | Dominican Republic | 0.0 /100 | #296 | Tragic 8.9% |
| Mexicans | 0.0 /100 | #297 | Tragic 8.9% |
| Tlingit-Haida | 0.0 /100 | #298 | Tragic 8.9% |
| Immigrants | Jamaica | 0.0 /100 | #299 | Tragic 8.9% |
| Creek | 0.0 /100 | #300 | Tragic 8.9% |
| Chickasaw | 0.0 /100 | #301 | Tragic 9.0% |
| Hispanics or Latinos | 0.0 /100 | #302 | Tragic 9.0% |
| Immigrants | West Indies | 0.0 /100 | #303 | Tragic 9.0% |
| Immigrants | Mexico | 0.0 /100 | #304 | Tragic 9.1% |
Demographics Similar to Afghans by Unemployment Among Women with Children Under 6 years
In terms of unemployment among women with children under 6 years, the demographic groups most similar to Afghans are Immigrants from Iraq (7.0%, a difference of 0.020%), Immigrants from Eritrea (7.0%, a difference of 0.040%), Paraguayan (7.0%, a difference of 0.070%), Cuban (7.0%, a difference of 0.11%), and Immigrants from Netherlands (7.0%, a difference of 0.30%).
| Demographics | Rating | Rank | Unemployment Among Women with Children Under 6 years |
| Tongans | 99.7 /100 | #64 | Exceptional 6.9% |
| Immigrants | Kuwait | 99.7 /100 | #65 | Exceptional 6.9% |
| Immigrants | Belgium | 99.6 /100 | #66 | Exceptional 6.9% |
| Immigrants | Netherlands | 99.5 /100 | #67 | Exceptional 7.0% |
| Paraguayans | 99.4 /100 | #68 | Exceptional 7.0% |
| Immigrants | Eritrea | 99.4 /100 | #69 | Exceptional 7.0% |
| Immigrants | Iraq | 99.4 /100 | #70 | Exceptional 7.0% |
| Afghans | 99.4 /100 | #71 | Exceptional 7.0% |
| Cubans | 99.4 /100 | #72 | Exceptional 7.0% |
| Immigrants | Czechoslovakia | 99.2 /100 | #73 | Exceptional 7.0% |
| Turks | 99.2 /100 | #74 | Exceptional 7.0% |
| Immigrants | Eastern Europe | 99.0 /100 | #75 | Exceptional 7.1% |
| Estonians | 99.0 /100 | #76 | Exceptional 7.1% |
| Immigrants | Croatia | 98.9 /100 | #77 | Exceptional 7.1% |
| Immigrants | Somalia | 98.9 /100 | #78 | Exceptional 7.1% |