Ugandan vs Sudanese Unemployment Among Ages 45 to 54 years
COMPARE
Ugandan
Sudanese
Unemployment Among Ages 45 to 54 years
Unemployment Among Ages 45 to 54 years Comparison
Ugandans
Sudanese
4.9%
UNEMPLOYMENT AMONG AGES 45 TO 54 YEARS
0.1/ 100
METRIC RATING
259th/ 347
METRIC RANK
4.3%
UNEMPLOYMENT AMONG AGES 45 TO 54 YEARS
97.0/ 100
METRIC RATING
87th/ 347
METRIC RANK
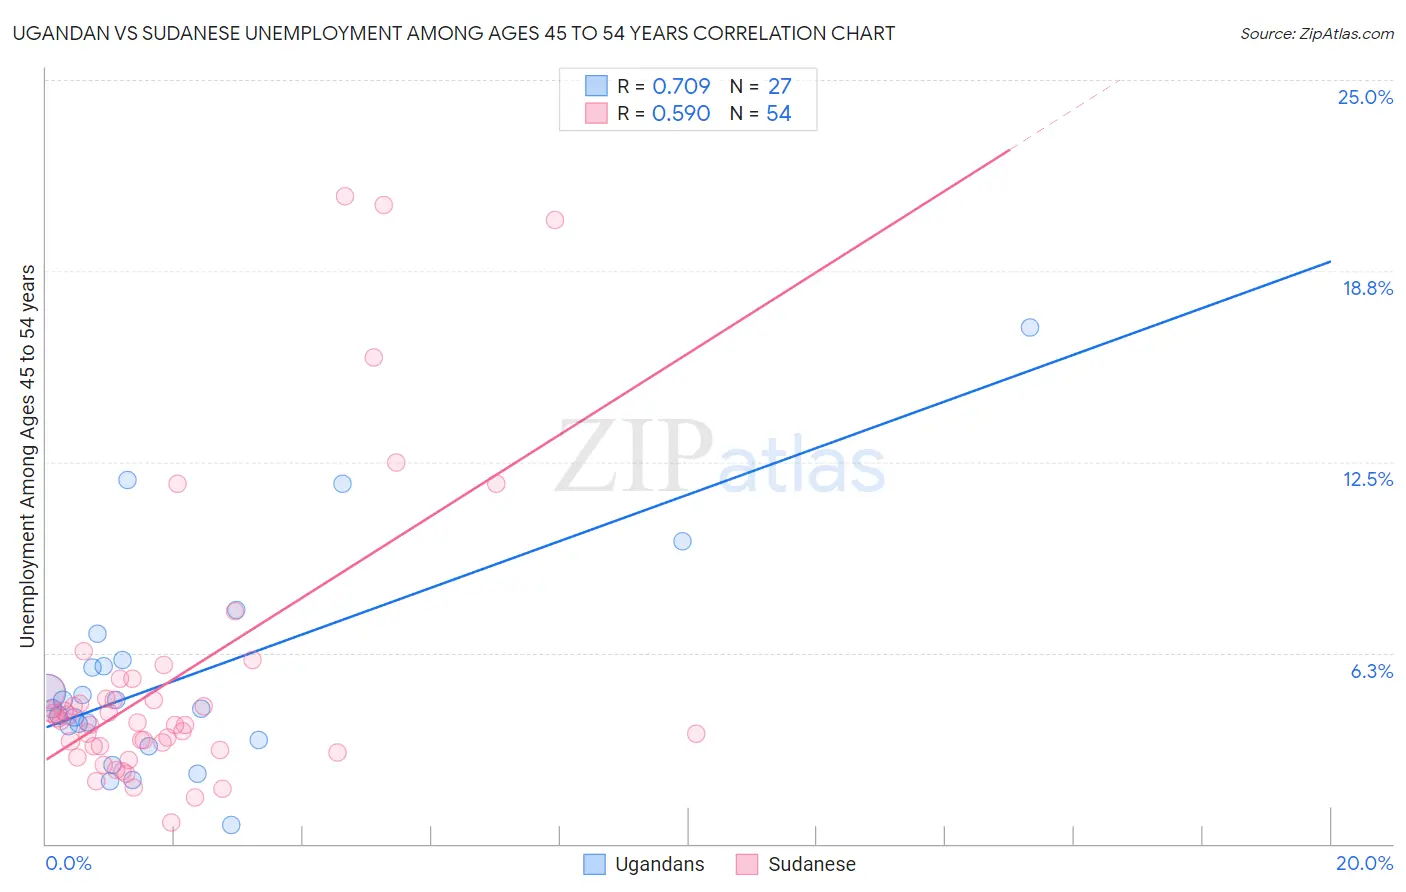
Ugandan vs Sudanese Unemployment Among Ages 45 to 54 years Correlation Chart
The statistical analysis conducted on geographies consisting of 93,516,543 people shows a strong positive correlation between the proportion of Ugandans and unemployment rate among population between the ages 45 and 54 in the United States with a correlation coefficient (R) of 0.709 and weighted average of 4.9%. Similarly, the statistical analysis conducted on geographies consisting of 109,181,196 people shows a substantial positive correlation between the proportion of Sudanese and unemployment rate among population between the ages 45 and 54 in the United States with a correlation coefficient (R) of 0.590 and weighted average of 4.3%, a difference of 12.1%.
Unemployment Among Ages 45 to 54 years Correlation Summary
| Measurement | Ugandan | Sudanese |
| Minimum | 0.60% | 0.70% |
| Maximum | 16.9% | 21.2% |
| Range | 16.3% | 20.5% |
| Mean | 5.4% | 5.4% |
| Median | 4.4% | 4.0% |
| Interquartile 25% (IQ1) | 3.4% | 3.2% |
| Interquartile 75% (IQ3) | 6.0% | 5.0% |
| Interquartile Range (IQR) | 2.6% | 1.8% |
| Standard Deviation (Sample) | 3.6% | 4.7% |
| Standard Deviation (Population) | 3.5% | 4.6% |
Similar Demographics by Unemployment Among Ages 45 to 54 years
Demographics Similar to Ugandans by Unemployment Among Ages 45 to 54 years
In terms of unemployment among ages 45 to 54 years, the demographic groups most similar to Ugandans are Mexican American Indian (4.9%, a difference of 0.010%), Guatemalan (4.9%, a difference of 0.020%), Subsaharan African (4.9%, a difference of 0.15%), Immigrants from Western Africa (4.9%, a difference of 0.18%), and Mexican (4.9%, a difference of 0.25%).
| Demographics | Rating | Rank | Unemployment Among Ages 45 to 54 years |
| Immigrants | Bahamas | 0.3 /100 | #252 | Tragic 4.8% |
| Moroccans | 0.3 /100 | #253 | Tragic 4.8% |
| Immigrants | Lebanon | 0.2 /100 | #254 | Tragic 4.8% |
| Immigrants | El Salvador | 0.2 /100 | #255 | Tragic 4.8% |
| Immigrants | Western Asia | 0.2 /100 | #256 | Tragic 4.8% |
| Immigrants | Western Africa | 0.2 /100 | #257 | Tragic 4.9% |
| Sub-Saharan Africans | 0.2 /100 | #258 | Tragic 4.9% |
| Ugandans | 0.1 /100 | #259 | Tragic 4.9% |
| Mexican American Indians | 0.1 /100 | #260 | Tragic 4.9% |
| Guatemalans | 0.1 /100 | #261 | Tragic 4.9% |
| Mexicans | 0.1 /100 | #262 | Tragic 4.9% |
| Immigrants | Fiji | 0.1 /100 | #263 | Tragic 4.9% |
| Immigrants | Guatemala | 0.1 /100 | #264 | Tragic 4.9% |
| Immigrants | Somalia | 0.1 /100 | #265 | Tragic 4.9% |
| Ghanaians | 0.0 /100 | #266 | Tragic 4.9% |
Demographics Similar to Sudanese by Unemployment Among Ages 45 to 54 years
In terms of unemployment among ages 45 to 54 years, the demographic groups most similar to Sudanese are Immigrants from Turkey (4.3%, a difference of 0.030%), Immigrants from Argentina (4.3%, a difference of 0.040%), Asian (4.3%, a difference of 0.090%), Ethiopian (4.3%, a difference of 0.10%), and Italian (4.3%, a difference of 0.14%).
| Demographics | Rating | Rank | Unemployment Among Ages 45 to 54 years |
| Cambodians | 97.8 /100 | #80 | Exceptional 4.3% |
| Immigrants | Micronesia | 97.6 /100 | #81 | Exceptional 4.3% |
| Eastern Europeans | 97.6 /100 | #82 | Exceptional 4.3% |
| Australians | 97.4 /100 | #83 | Exceptional 4.3% |
| Italians | 97.3 /100 | #84 | Exceptional 4.3% |
| French | 97.3 /100 | #85 | Exceptional 4.3% |
| Ethiopians | 97.2 /100 | #86 | Exceptional 4.3% |
| Sudanese | 97.0 /100 | #87 | Exceptional 4.3% |
| Immigrants | Turkey | 96.9 /100 | #88 | Exceptional 4.3% |
| Immigrants | Argentina | 96.9 /100 | #89 | Exceptional 4.3% |
| Asians | 96.8 /100 | #90 | Exceptional 4.3% |
| Ukrainians | 96.6 /100 | #91 | Exceptional 4.3% |
| Mongolians | 96.6 /100 | #92 | Exceptional 4.3% |
| Argentineans | 96.5 /100 | #93 | Exceptional 4.3% |
| Immigrants | Malaysia | 96.2 /100 | #94 | Exceptional 4.4% |