Sri Lankan vs Sudanese Unemployment Among Ages 45 to 54 years
COMPARE
Sri Lankan
Sudanese
Unemployment Among Ages 45 to 54 years
Unemployment Among Ages 45 to 54 years Comparison
Sri Lankans
Sudanese
4.4%
UNEMPLOYMENT AMONG AGES 45 TO 54 YEARS
93.7/ 100
METRIC RATING
102nd/ 347
METRIC RANK
4.3%
UNEMPLOYMENT AMONG AGES 45 TO 54 YEARS
97.0/ 100
METRIC RATING
87th/ 347
METRIC RANK
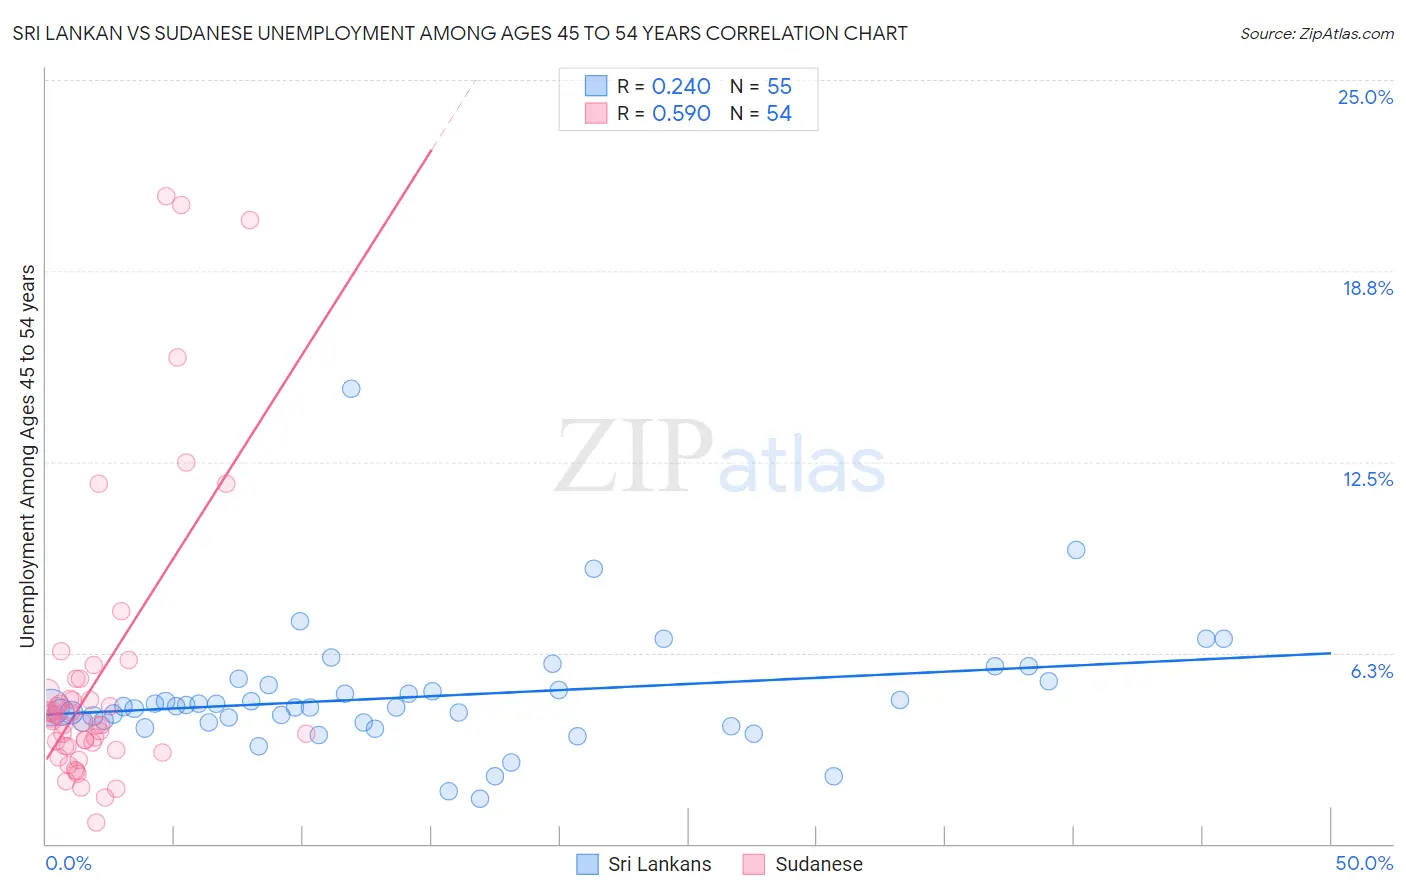
Sri Lankan vs Sudanese Unemployment Among Ages 45 to 54 years Correlation Chart
The statistical analysis conducted on geographies consisting of 427,577,132 people shows a weak positive correlation between the proportion of Sri Lankans and unemployment rate among population between the ages 45 and 54 in the United States with a correlation coefficient (R) of 0.240 and weighted average of 4.4%. Similarly, the statistical analysis conducted on geographies consisting of 109,181,196 people shows a substantial positive correlation between the proportion of Sudanese and unemployment rate among population between the ages 45 and 54 in the United States with a correlation coefficient (R) of 0.590 and weighted average of 4.3%, a difference of 0.96%.
Unemployment Among Ages 45 to 54 years Correlation Summary
| Measurement | Sri Lankan | Sudanese |
| Minimum | 1.5% | 0.70% |
| Maximum | 14.9% | 21.2% |
| Range | 13.4% | 20.5% |
| Mean | 4.8% | 5.4% |
| Median | 4.5% | 4.0% |
| Interquartile 25% (IQ1) | 4.0% | 3.2% |
| Interquartile 75% (IQ3) | 5.2% | 5.0% |
| Interquartile Range (IQR) | 1.2% | 1.8% |
| Standard Deviation (Sample) | 2.0% | 4.7% |
| Standard Deviation (Population) | 2.0% | 4.6% |
Demographics Similar to Sri Lankans and Sudanese by Unemployment Among Ages 45 to 54 years
In terms of unemployment among ages 45 to 54 years, the demographic groups most similar to Sri Lankans are Icelander (4.4%, a difference of 0.030%), Immigrants from North America (4.4%, a difference of 0.050%), Immigrants from Sweden (4.4%, a difference of 0.13%), Immigrants from Eritrea (4.4%, a difference of 0.24%), and Immigrants from Burma/Myanmar (4.4%, a difference of 0.27%). Similarly, the demographic groups most similar to Sudanese are Immigrants from Turkey (4.3%, a difference of 0.030%), Immigrants from Argentina (4.3%, a difference of 0.040%), Asian (4.3%, a difference of 0.090%), Ethiopian (4.3%, a difference of 0.10%), and Italian (4.3%, a difference of 0.14%).
| Demographics | Rating | Rank | Unemployment Among Ages 45 to 54 years |
| Italians | 97.3 /100 | #84 | Exceptional 4.3% |
| French | 97.3 /100 | #85 | Exceptional 4.3% |
| Ethiopians | 97.2 /100 | #86 | Exceptional 4.3% |
| Sudanese | 97.0 /100 | #87 | Exceptional 4.3% |
| Immigrants | Turkey | 96.9 /100 | #88 | Exceptional 4.3% |
| Immigrants | Argentina | 96.9 /100 | #89 | Exceptional 4.3% |
| Asians | 96.8 /100 | #90 | Exceptional 4.3% |
| Ukrainians | 96.6 /100 | #91 | Exceptional 4.3% |
| Mongolians | 96.6 /100 | #92 | Exceptional 4.3% |
| Argentineans | 96.5 /100 | #93 | Exceptional 4.3% |
| Immigrants | Malaysia | 96.2 /100 | #94 | Exceptional 4.4% |
| Immigrants | Ethiopia | 96.1 /100 | #95 | Exceptional 4.4% |
| Indonesians | 95.4 /100 | #96 | Exceptional 4.4% |
| Immigrants | Canada | 95.0 /100 | #97 | Exceptional 4.4% |
| Romanians | 94.9 /100 | #98 | Exceptional 4.4% |
| Immigrants | Burma/Myanmar | 94.9 /100 | #99 | Exceptional 4.4% |
| Immigrants | Eritrea | 94.7 /100 | #100 | Exceptional 4.4% |
| Immigrants | North America | 93.9 /100 | #101 | Exceptional 4.4% |
| Sri Lankans | 93.7 /100 | #102 | Exceptional 4.4% |
| Icelanders | 93.5 /100 | #103 | Exceptional 4.4% |
| Immigrants | Sweden | 93.0 /100 | #104 | Exceptional 4.4% |