Immigrants from Austria vs Finnish 5th Grade
COMPARE
Immigrants from Austria
Finnish
5th Grade
5th Grade Comparison
Immigrants from Austria
Finns
97.9%
5TH GRADE
99.6/ 100
METRIC RATING
66th/ 347
METRIC RANK
98.2%
5TH GRADE
100.0/ 100
METRIC RATING
19th/ 347
METRIC RANK
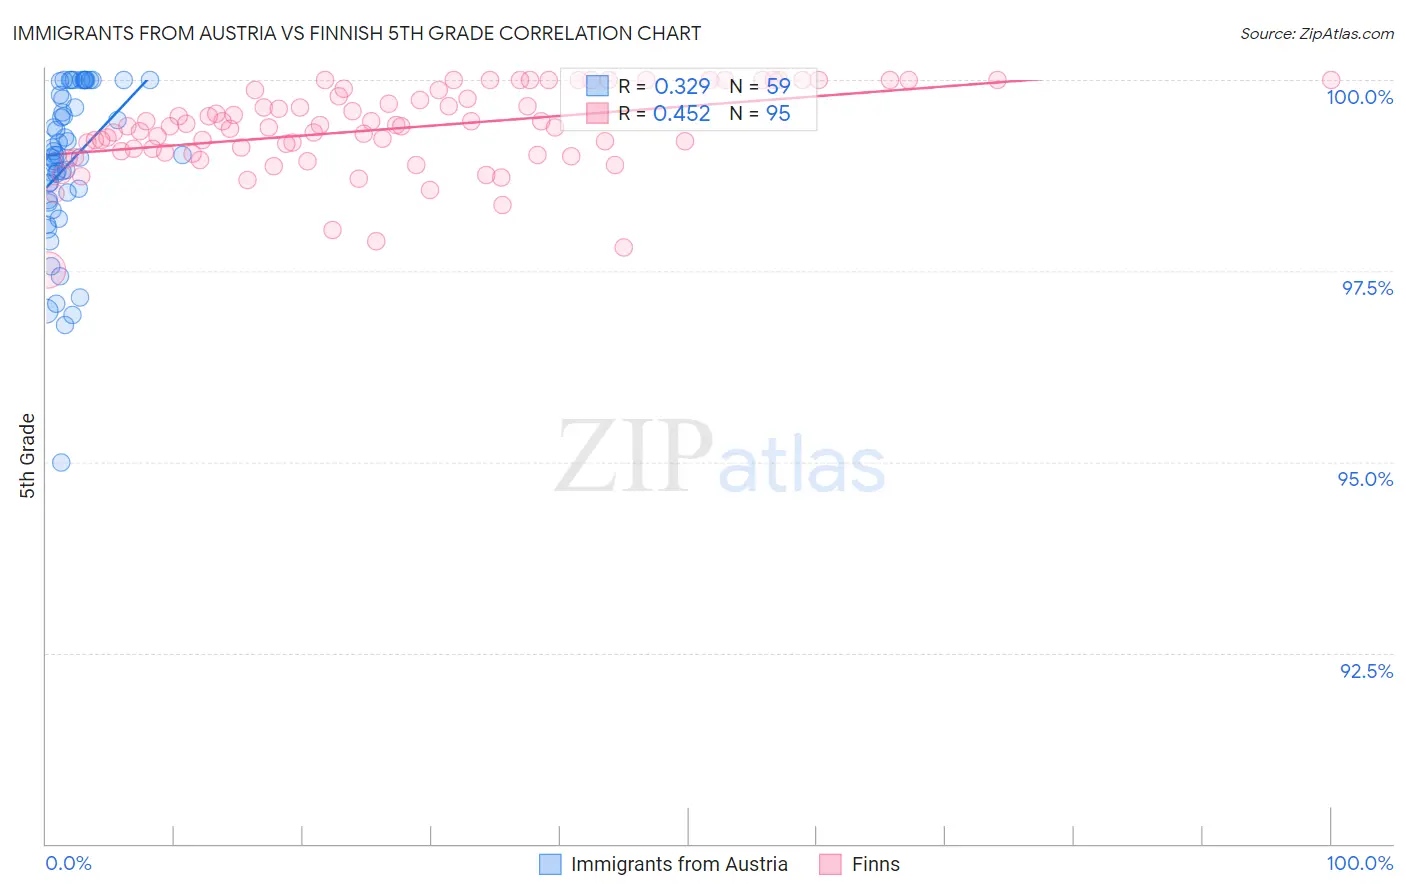
Immigrants from Austria vs Finnish 5th Grade Correlation Chart
The statistical analysis conducted on geographies consisting of 167,973,800 people shows a mild positive correlation between the proportion of Immigrants from Austria and percentage of population with at least 5th grade education in the United States with a correlation coefficient (R) of 0.329 and weighted average of 97.9%. Similarly, the statistical analysis conducted on geographies consisting of 404,675,625 people shows a moderate positive correlation between the proportion of Finns and percentage of population with at least 5th grade education in the United States with a correlation coefficient (R) of 0.452 and weighted average of 98.2%, a difference of 0.36%.
5th Grade Correlation Summary
| Measurement | Immigrants from Austria | Finnish |
| Minimum | 95.0% | 97.5% |
| Maximum | 100.0% | 100.0% |
| Range | 5.0% | 2.5% |
| Mean | 98.9% | 99.4% |
| Median | 99.0% | 99.4% |
| Interquartile 25% (IQ1) | 98.4% | 99.0% |
| Interquartile 75% (IQ3) | 99.8% | 99.9% |
| Interquartile Range (IQR) | 1.4% | 0.82% |
| Standard Deviation (Sample) | 1.0% | 0.54% |
| Standard Deviation (Population) | 1.0% | 0.54% |
Similar Demographics by 5th Grade
Demographics Similar to Immigrants from Austria by 5th Grade
In terms of 5th grade, the demographic groups most similar to Immigrants from Austria are Canadian (97.9%, a difference of 0.0%), New Zealander (97.9%, a difference of 0.0%), Immigrants from Northern Europe (97.9%, a difference of 0.010%), Cajun (97.9%, a difference of 0.010%), and Russian (97.9%, a difference of 0.020%).
| Demographics | Rating | Rank | 5th Grade |
| Americans | 99.7 /100 | #59 | Exceptional 97.9% |
| Immigrants | Canada | 99.7 /100 | #60 | Exceptional 97.9% |
| Serbians | 99.7 /100 | #61 | Exceptional 97.9% |
| Immigrants | North America | 99.7 /100 | #62 | Exceptional 97.9% |
| Russians | 99.7 /100 | #63 | Exceptional 97.9% |
| Immigrants | Northern Europe | 99.6 /100 | #64 | Exceptional 97.9% |
| Canadians | 99.6 /100 | #65 | Exceptional 97.9% |
| Immigrants | Austria | 99.6 /100 | #66 | Exceptional 97.9% |
| New Zealanders | 99.6 /100 | #67 | Exceptional 97.9% |
| Cajuns | 99.6 /100 | #68 | Exceptional 97.9% |
| Kiowa | 99.5 /100 | #69 | Exceptional 97.9% |
| Iranians | 99.5 /100 | #70 | Exceptional 97.9% |
| Chickasaw | 99.5 /100 | #71 | Exceptional 97.9% |
| Macedonians | 99.4 /100 | #72 | Exceptional 97.9% |
| Cherokee | 99.4 /100 | #73 | Exceptional 97.8% |
Demographics Similar to Finns by 5th Grade
In terms of 5th grade, the demographic groups most similar to Finns are Lithuanian (98.2%, a difference of 0.0%), Irish (98.3%, a difference of 0.010%), Pennsylvania German (98.3%, a difference of 0.010%), Polish (98.3%, a difference of 0.020%), and Scottish (98.3%, a difference of 0.030%).
| Demographics | Rating | Rank | 5th Grade |
| Carpatho Rusyns | 100.0 /100 | #12 | Exceptional 98.3% |
| Tlingit-Haida | 100.0 /100 | #13 | Exceptional 98.3% |
| Dutch | 100.0 /100 | #14 | Exceptional 98.3% |
| Scottish | 100.0 /100 | #15 | Exceptional 98.3% |
| Poles | 100.0 /100 | #16 | Exceptional 98.3% |
| Irish | 100.0 /100 | #17 | Exceptional 98.3% |
| Pennsylvania Germans | 100.0 /100 | #18 | Exceptional 98.3% |
| Finns | 100.0 /100 | #19 | Exceptional 98.2% |
| Lithuanians | 100.0 /100 | #20 | Exceptional 98.2% |
| Danes | 100.0 /100 | #21 | Exceptional 98.2% |
| Croatians | 100.0 /100 | #22 | Exceptional 98.2% |
| Sioux | 100.0 /100 | #23 | Exceptional 98.2% |
| Scotch-Irish | 100.0 /100 | #24 | Exceptional 98.2% |
| Yup'ik | 100.0 /100 | #25 | Exceptional 98.2% |
| Alaska Natives | 100.0 /100 | #26 | Exceptional 98.2% |