Immigrants from Asia vs Immigrants from Belgium Unemployment Among Women with Children Under 6 years
COMPARE
Immigrants from Asia
Immigrants from Belgium
Unemployment Among Women with Children Under 6 years
Unemployment Among Women with Children Under 6 years Comparison
Immigrants from Asia
Immigrants from Belgium
6.8%
UNEMPLOYMENT AMONG WOMEN WITH CHILDREN UNDER 6 YEARS
99.9/ 100
METRIC RATING
47th/ 347
METRIC RANK
6.9%
UNEMPLOYMENT AMONG WOMEN WITH CHILDREN UNDER 6 YEARS
99.6/ 100
METRIC RATING
66th/ 347
METRIC RANK
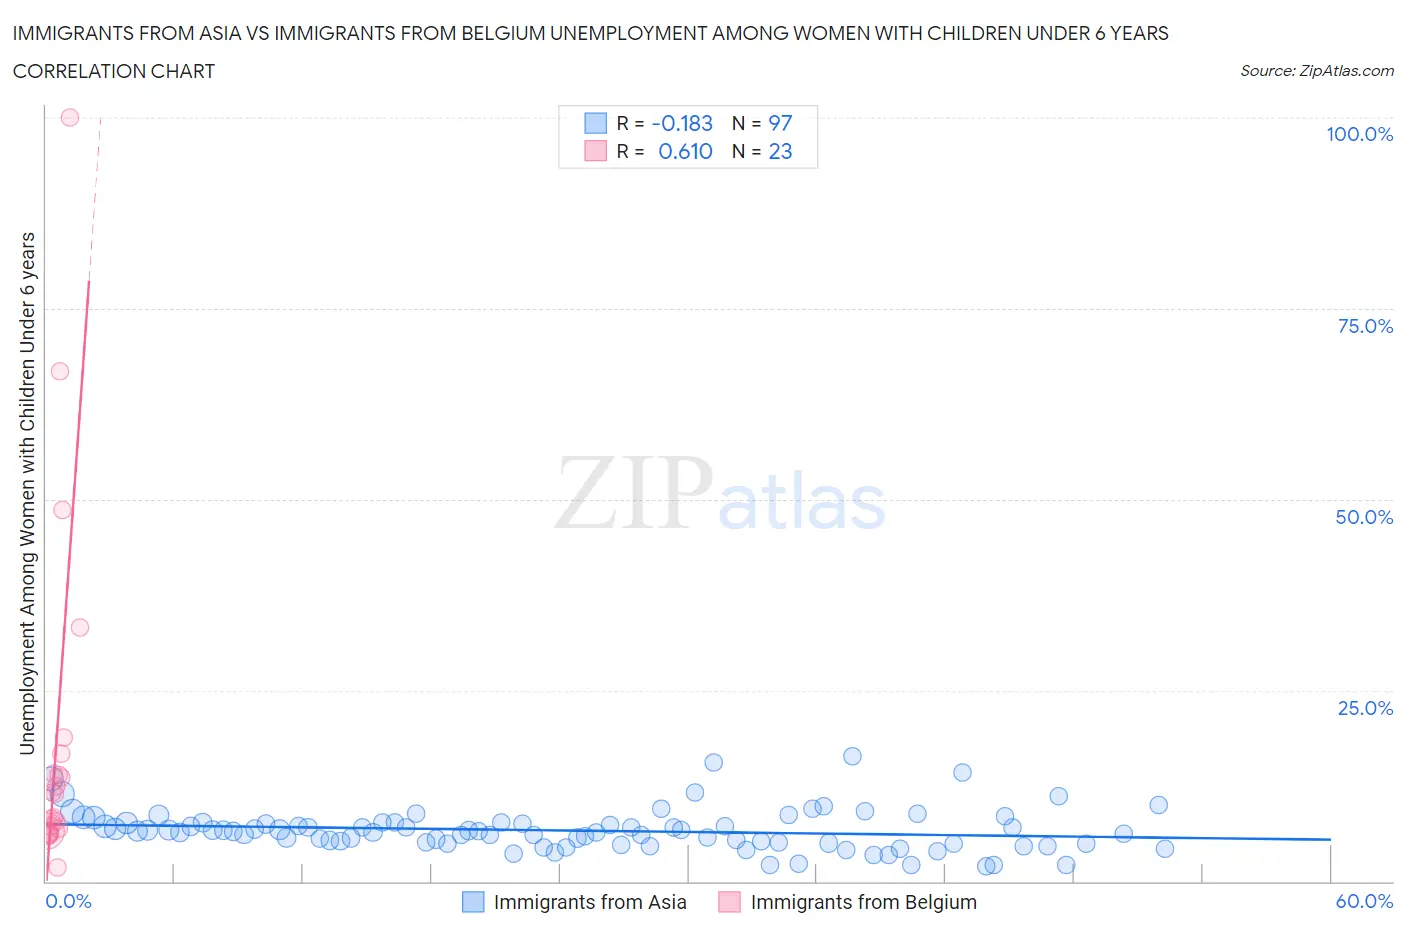
Immigrants from Asia vs Immigrants from Belgium Unemployment Among Women with Children Under 6 years Correlation Chart
The statistical analysis conducted on geographies consisting of 374,283,619 people shows a poor negative correlation between the proportion of Immigrants from Asia and unemployment rate among women with children under the age of 6 in the United States with a correlation coefficient (R) of -0.183 and weighted average of 6.8%. Similarly, the statistical analysis conducted on geographies consisting of 126,448,040 people shows a significant positive correlation between the proportion of Immigrants from Belgium and unemployment rate among women with children under the age of 6 in the United States with a correlation coefficient (R) of 0.610 and weighted average of 6.9%, a difference of 2.4%.
Unemployment Among Women with Children Under 6 years Correlation Summary
| Measurement | Immigrants from Asia | Immigrants from Belgium |
| Minimum | 1.9% | 1.8% |
| Maximum | 16.3% | 100.0% |
| Range | 14.4% | 98.2% |
| Mean | 6.6% | 18.8% |
| Median | 6.5% | 11.4% |
| Interquartile 25% (IQ1) | 5.0% | 6.5% |
| Interquartile 75% (IQ3) | 7.6% | 16.7% |
| Interquartile Range (IQR) | 2.7% | 10.2% |
| Standard Deviation (Sample) | 2.7% | 23.3% |
| Standard Deviation (Population) | 2.7% | 22.7% |
Demographics Similar to Immigrants from Asia and Immigrants from Belgium by Unemployment Among Women with Children Under 6 years
In terms of unemployment among women with children under 6 years, the demographic groups most similar to Immigrants from Asia are Immigrants from Switzerland (6.8%, a difference of 0.030%), Immigrants from Nepal (6.8%, a difference of 0.080%), Immigrants from Ireland (6.8%, a difference of 0.090%), Ethiopian (6.8%, a difference of 0.11%), and Latvian (6.8%, a difference of 0.17%). Similarly, the demographic groups most similar to Immigrants from Belgium are Immigrants from Kuwait (6.9%, a difference of 0.22%), Tongan (6.9%, a difference of 0.37%), Maltese (6.9%, a difference of 0.47%), Somali (6.9%, a difference of 0.52%), and Immigrants from France (6.9%, a difference of 0.56%).
| Demographics | Rating | Rank | Unemployment Among Women with Children Under 6 years |
| Latvians | 99.9 /100 | #46 | Exceptional 6.8% |
| Immigrants | Asia | 99.9 /100 | #47 | Exceptional 6.8% |
| Immigrants | Switzerland | 99.9 /100 | #48 | Exceptional 6.8% |
| Immigrants | Nepal | 99.9 /100 | #49 | Exceptional 6.8% |
| Immigrants | Ireland | 99.9 /100 | #50 | Exceptional 6.8% |
| Ethiopians | 99.9 /100 | #51 | Exceptional 6.8% |
| Immigrants | Iran | 99.9 /100 | #52 | Exceptional 6.8% |
| Chinese | 99.9 /100 | #53 | Exceptional 6.8% |
| Immigrants | Latvia | 99.9 /100 | #54 | Exceptional 6.8% |
| Immigrants | Ukraine | 99.8 /100 | #55 | Exceptional 6.8% |
| Immigrants | Ethiopia | 99.8 /100 | #56 | Exceptional 6.9% |
| Icelanders | 99.8 /100 | #57 | Exceptional 6.9% |
| Immigrants | Turkey | 99.8 /100 | #58 | Exceptional 6.9% |
| Immigrants | Serbia | 99.8 /100 | #59 | Exceptional 6.9% |
| Immigrants | Sri Lanka | 99.8 /100 | #60 | Exceptional 6.9% |
| Immigrants | France | 99.7 /100 | #61 | Exceptional 6.9% |
| Somalis | 99.7 /100 | #62 | Exceptional 6.9% |
| Maltese | 99.7 /100 | #63 | Exceptional 6.9% |
| Tongans | 99.7 /100 | #64 | Exceptional 6.9% |
| Immigrants | Kuwait | 99.7 /100 | #65 | Exceptional 6.9% |
| Immigrants | Belgium | 99.6 /100 | #66 | Exceptional 6.9% |