Immigrants from Asia vs Immigrants from Dominican Republic Unemployment Among Women with Children Under 18 years
COMPARE
Immigrants from Asia
Immigrants from Dominican Republic
Unemployment Among Women with Children Under 18 years
Unemployment Among Women with Children Under 18 years Comparison
Immigrants from Asia
Immigrants from Dominican Republic
5.1%
UNEMPLOYMENT AMONG WOMEN WITH CHILDREN UNDER 18 YEARS
95.8/ 100
METRIC RATING
75th/ 347
METRIC RANK
7.5%
UNEMPLOYMENT AMONG WOMEN WITH CHILDREN UNDER 18 YEARS
0.0/ 100
METRIC RATING
333rd/ 347
METRIC RANK
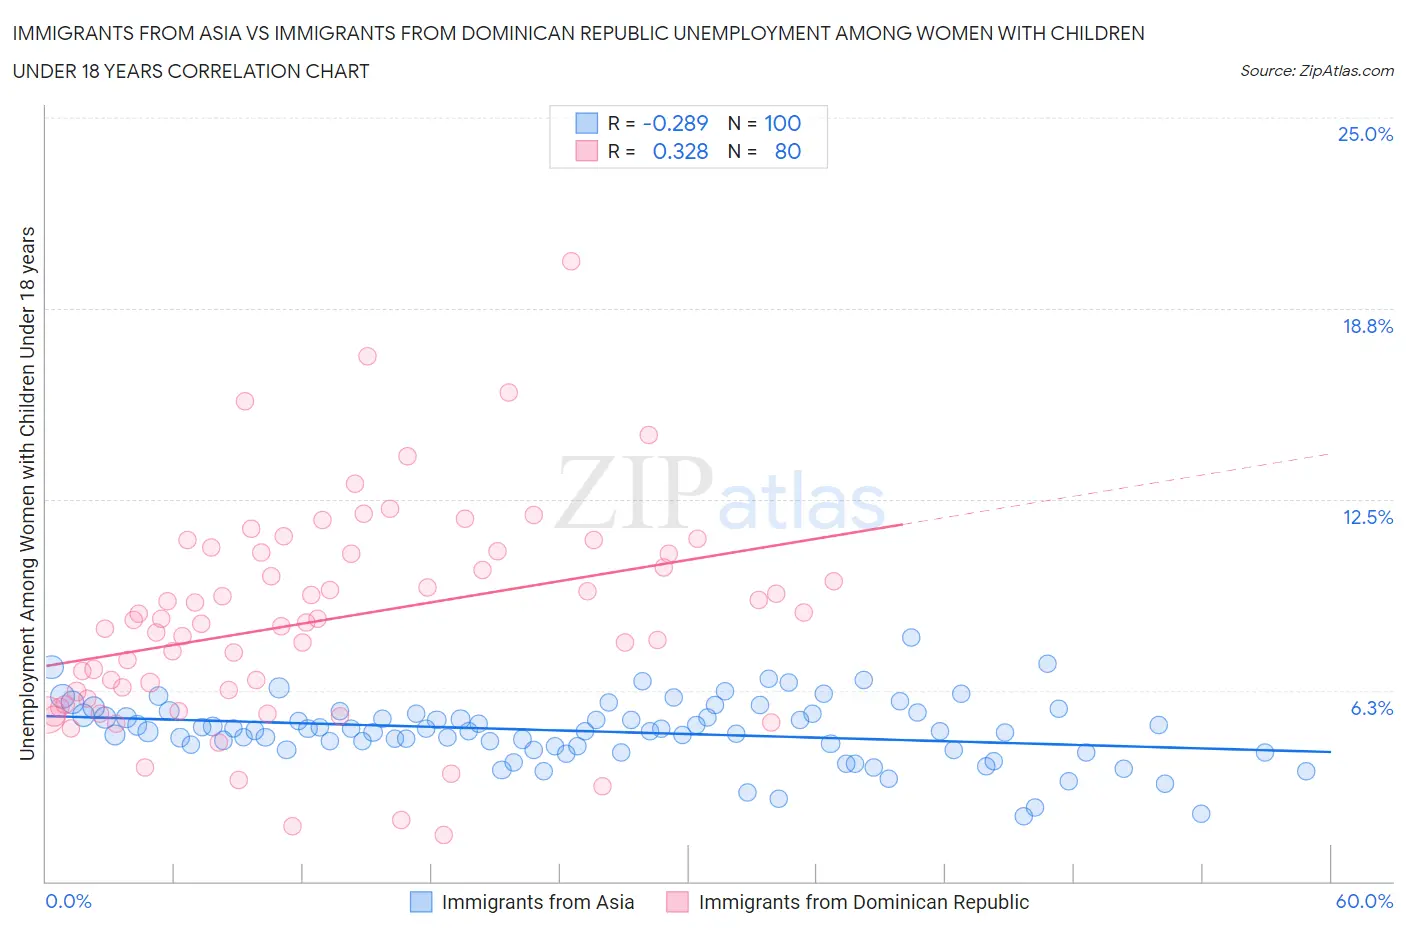
Immigrants from Asia vs Immigrants from Dominican Republic Unemployment Among Women with Children Under 18 years Correlation Chart
The statistical analysis conducted on geographies consisting of 506,016,351 people shows a weak negative correlation between the proportion of Immigrants from Asia and unemployment rate among women with children under the age of 18 in the United States with a correlation coefficient (R) of -0.289 and weighted average of 5.1%. Similarly, the statistical analysis conducted on geographies consisting of 268,233,481 people shows a mild positive correlation between the proportion of Immigrants from Dominican Republic and unemployment rate among women with children under the age of 18 in the United States with a correlation coefficient (R) of 0.328 and weighted average of 7.5%, a difference of 45.7%.
Unemployment Among Women with Children Under 18 years Correlation Summary
| Measurement | Immigrants from Asia | Immigrants from Dominican Republic |
| Minimum | 2.1% | 1.5% |
| Maximum | 8.0% | 20.3% |
| Range | 5.9% | 18.8% |
| Mean | 4.9% | 8.6% |
| Median | 4.9% | 8.5% |
| Interquartile 25% (IQ1) | 4.4% | 6.1% |
| Interquartile 75% (IQ3) | 5.5% | 10.7% |
| Interquartile Range (IQR) | 1.1% | 4.6% |
| Standard Deviation (Sample) | 1.0% | 3.5% |
| Standard Deviation (Population) | 1.0% | 3.5% |
Similar Demographics by Unemployment Among Women with Children Under 18 years
Demographics Similar to Immigrants from Asia by Unemployment Among Women with Children Under 18 years
In terms of unemployment among women with children under 18 years, the demographic groups most similar to Immigrants from Asia are Immigrants from Northern Europe (5.1%, a difference of 0.030%), Puget Sound Salish (5.1%, a difference of 0.030%), Albanian (5.1%, a difference of 0.040%), Zimbabwean (5.1%, a difference of 0.040%), and Assyrian/Chaldean/Syriac (5.1%, a difference of 0.070%).
| Demographics | Rating | Rank | Unemployment Among Women with Children Under 18 years |
| Irish | 96.8 /100 | #68 | Exceptional 5.1% |
| Austrians | 96.6 /100 | #69 | Exceptional 5.1% |
| Icelanders | 96.6 /100 | #70 | Exceptional 5.1% |
| Serbians | 96.5 /100 | #71 | Exceptional 5.1% |
| Immigrants | Bolivia | 96.1 /100 | #72 | Exceptional 5.1% |
| Albanians | 95.9 /100 | #73 | Exceptional 5.1% |
| Immigrants | Northern Europe | 95.9 /100 | #74 | Exceptional 5.1% |
| Immigrants | Asia | 95.8 /100 | #75 | Exceptional 5.1% |
| Puget Sound Salish | 95.8 /100 | #76 | Exceptional 5.1% |
| Zimbabweans | 95.7 /100 | #77 | Exceptional 5.1% |
| Assyrians/Chaldeans/Syriacs | 95.7 /100 | #78 | Exceptional 5.1% |
| Immigrants | Croatia | 95.6 /100 | #79 | Exceptional 5.1% |
| Bolivians | 95.5 /100 | #80 | Exceptional 5.1% |
| Immigrants | Lithuania | 95.4 /100 | #81 | Exceptional 5.2% |
| Romanians | 95.3 /100 | #82 | Exceptional 5.2% |
Demographics Similar to Immigrants from Dominican Republic by Unemployment Among Women with Children Under 18 years
In terms of unemployment among women with children under 18 years, the demographic groups most similar to Immigrants from Dominican Republic are Dominican (7.5%, a difference of 0.36%), Hopi (7.4%, a difference of 0.90%), Colville (7.4%, a difference of 1.5%), Black/African American (7.3%, a difference of 2.9%), and Native/Alaskan (7.2%, a difference of 3.4%).
| Demographics | Rating | Rank | Unemployment Among Women with Children Under 18 years |
| Chippewa | 0.0 /100 | #326 | Tragic 7.0% |
| Lumbee | 0.0 /100 | #327 | Tragic 7.1% |
| Natives/Alaskans | 0.0 /100 | #328 | Tragic 7.2% |
| Blacks/African Americans | 0.0 /100 | #329 | Tragic 7.3% |
| Colville | 0.0 /100 | #330 | Tragic 7.4% |
| Hopi | 0.0 /100 | #331 | Tragic 7.4% |
| Dominicans | 0.0 /100 | #332 | Tragic 7.5% |
| Immigrants | Dominican Republic | 0.0 /100 | #333 | Tragic 7.5% |
| Cheyenne | 0.0 /100 | #334 | Tragic 7.8% |
| Apache | 0.0 /100 | #335 | Tragic 7.9% |
| Sioux | 0.0 /100 | #336 | Tragic 7.9% |
| Yakama | 0.0 /100 | #337 | Tragic 8.1% |
| Immigrants | Yemen | 0.0 /100 | #338 | Tragic 8.2% |
| Navajo | 0.0 /100 | #339 | Tragic 8.2% |
| Crow | 0.0 /100 | #340 | Tragic 8.2% |