Immigrants from Austria vs West Indian Unemployment Among Ages 45 to 54 years
COMPARE
Immigrants from Austria
West Indian
Unemployment Among Ages 45 to 54 years
Unemployment Among Ages 45 to 54 years Comparison
Immigrants from Austria
West Indians
4.5%
UNEMPLOYMENT AMONG AGES 45 TO 54 YEARS
75.3/ 100
METRIC RATING
148th/ 347
METRIC RANK
5.3%
UNEMPLOYMENT AMONG AGES 45 TO 54 YEARS
0.0/ 100
METRIC RATING
297th/ 347
METRIC RANK
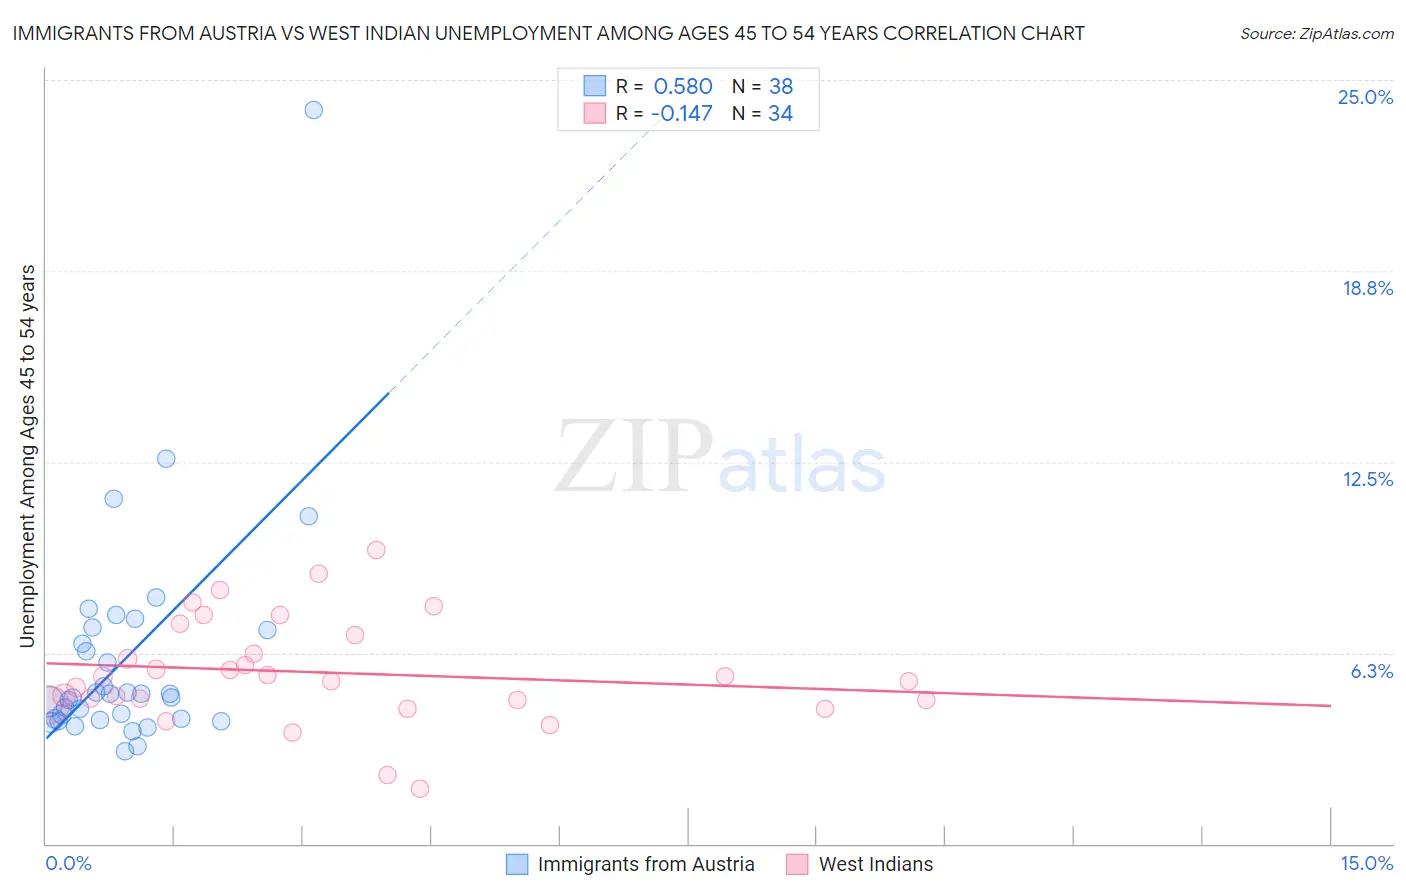
Immigrants from Austria vs West Indian Unemployment Among Ages 45 to 54 years Correlation Chart
The statistical analysis conducted on geographies consisting of 165,784,372 people shows a substantial positive correlation between the proportion of Immigrants from Austria and unemployment rate among population between the ages 45 and 54 in the United States with a correlation coefficient (R) of 0.580 and weighted average of 4.5%. Similarly, the statistical analysis conducted on geographies consisting of 250,886,233 people shows a poor negative correlation between the proportion of West Indians and unemployment rate among population between the ages 45 and 54 in the United States with a correlation coefficient (R) of -0.147 and weighted average of 5.3%, a difference of 18.0%.
Unemployment Among Ages 45 to 54 years Correlation Summary
| Measurement | Immigrants from Austria | West Indian |
| Minimum | 3.0% | 1.8% |
| Maximum | 24.0% | 9.6% |
| Range | 21.0% | 7.8% |
| Mean | 6.1% | 5.6% |
| Median | 4.9% | 5.4% |
| Interquartile 25% (IQ1) | 4.1% | 4.7% |
| Interquartile 75% (IQ3) | 7.0% | 6.8% |
| Interquartile Range (IQR) | 2.9% | 2.1% |
| Standard Deviation (Sample) | 3.7% | 1.7% |
| Standard Deviation (Population) | 3.7% | 1.7% |
Similar Demographics by Unemployment Among Ages 45 to 54 years
Demographics Similar to Immigrants from Austria by Unemployment Among Ages 45 to 54 years
In terms of unemployment among ages 45 to 54 years, the demographic groups most similar to Immigrants from Austria are Costa Rican (4.5%, a difference of 0.0%), Tsimshian (4.5%, a difference of 0.040%), Cypriot (4.5%, a difference of 0.060%), Uruguayan (4.5%, a difference of 0.10%), and Syrian (4.5%, a difference of 0.13%).
| Demographics | Rating | Rank | Unemployment Among Ages 45 to 54 years |
| Immigrants | Afghanistan | 79.6 /100 | #141 | Good 4.4% |
| Immigrants | Netherlands | 79.4 /100 | #142 | Good 4.4% |
| Macedonians | 79.0 /100 | #143 | Good 4.5% |
| Taiwanese | 77.9 /100 | #144 | Good 4.5% |
| Immigrants | Latvia | 77.5 /100 | #145 | Good 4.5% |
| Syrians | 77.3 /100 | #146 | Good 4.5% |
| Uruguayans | 76.9 /100 | #147 | Good 4.5% |
| Immigrants | Austria | 75.3 /100 | #148 | Good 4.5% |
| Costa Ricans | 75.3 /100 | #149 | Good 4.5% |
| Tsimshian | 74.6 /100 | #150 | Good 4.5% |
| Cypriots | 74.4 /100 | #151 | Good 4.5% |
| Koreans | 73.1 /100 | #152 | Good 4.5% |
| Hungarians | 73.0 /100 | #153 | Good 4.5% |
| Immigrants | Spain | 72.5 /100 | #154 | Good 4.5% |
| Marshallese | 70.6 /100 | #155 | Good 4.5% |
Demographics Similar to West Indians by Unemployment Among Ages 45 to 54 years
In terms of unemployment among ages 45 to 54 years, the demographic groups most similar to West Indians are Aleut (5.3%, a difference of 0.0%), Immigrants from Trinidad and Tobago (5.3%, a difference of 0.12%), Ecuadorian (5.3%, a difference of 0.14%), Jamaican (5.3%, a difference of 0.19%), and Belizean (5.2%, a difference of 0.34%).
| Demographics | Rating | Rank | Unemployment Among Ages 45 to 54 years |
| Immigrants | Portugal | 0.0 /100 | #290 | Tragic 5.2% |
| Armenians | 0.0 /100 | #291 | Tragic 5.2% |
| Trinidadians and Tobagonians | 0.0 /100 | #292 | Tragic 5.2% |
| Immigrants | Senegal | 0.0 /100 | #293 | Tragic 5.2% |
| Belizeans | 0.0 /100 | #294 | Tragic 5.2% |
| Jamaicans | 0.0 /100 | #295 | Tragic 5.3% |
| Aleuts | 0.0 /100 | #296 | Tragic 5.3% |
| West Indians | 0.0 /100 | #297 | Tragic 5.3% |
| Immigrants | Trinidad and Tobago | 0.0 /100 | #298 | Tragic 5.3% |
| Ecuadorians | 0.0 /100 | #299 | Tragic 5.3% |
| Central American Indians | 0.0 /100 | #300 | Tragic 5.3% |
| Menominee | 0.0 /100 | #301 | Tragic 5.3% |
| Immigrants | Ecuador | 0.0 /100 | #302 | Tragic 5.3% |
| Immigrants | Belize | 0.0 /100 | #303 | Tragic 5.3% |
| Immigrants | Jamaica | 0.0 /100 | #304 | Tragic 5.4% |