Taiwanese vs Houma Unemployment Among Ages 45 to 54 years
COMPARE
Taiwanese
Houma
Unemployment Among Ages 45 to 54 years
Unemployment Among Ages 45 to 54 years Comparison
Taiwanese
Houma
4.5%
UNEMPLOYMENT AMONG AGES 45 TO 54 YEARS
77.9/ 100
METRIC RATING
144th/ 347
METRIC RANK
5.6%
UNEMPLOYMENT AMONG AGES 45 TO 54 YEARS
0.0/ 100
METRIC RATING
317th/ 347
METRIC RANK
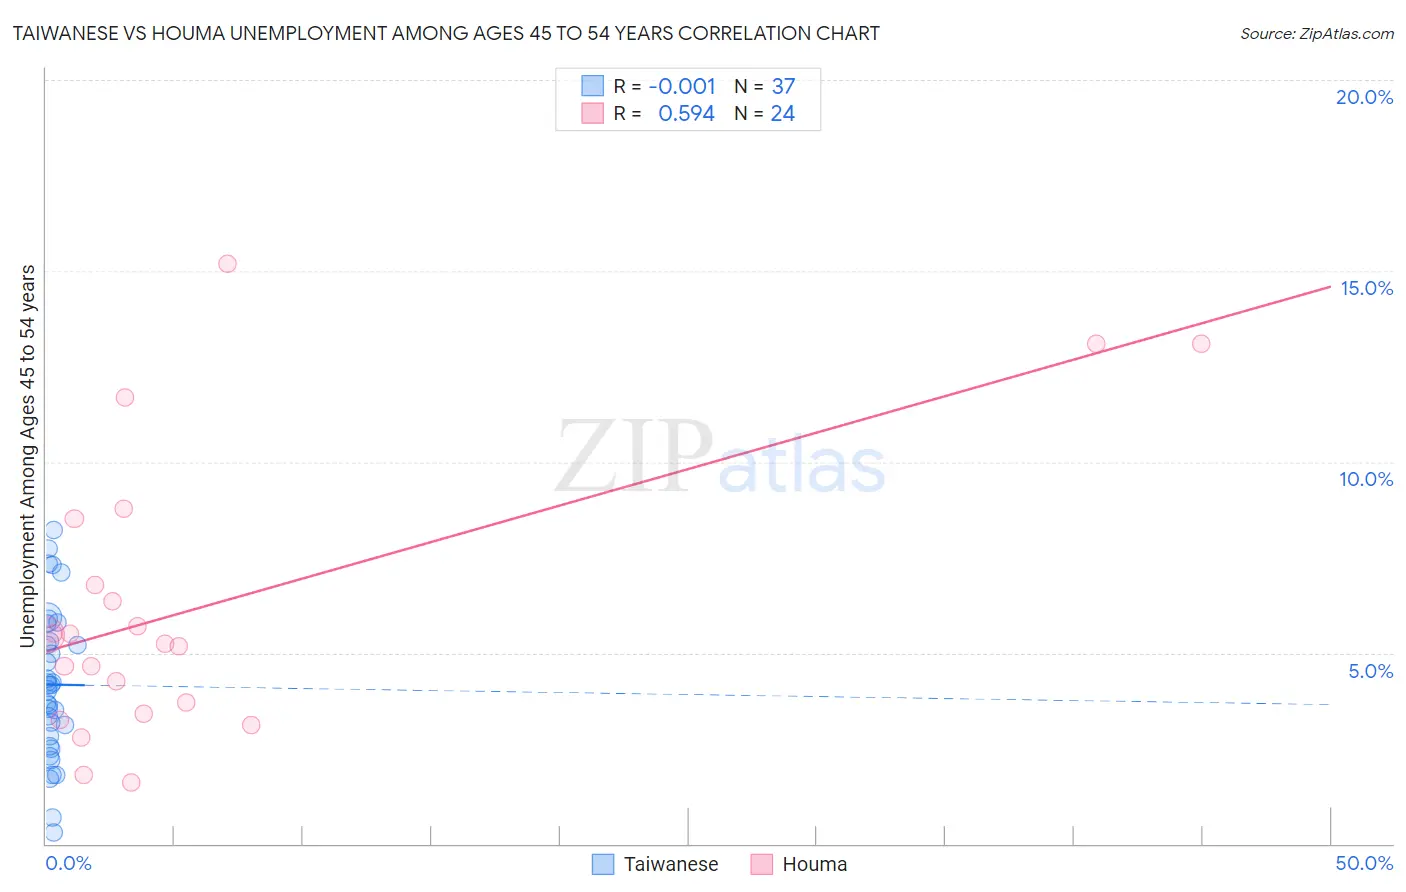
Taiwanese vs Houma Unemployment Among Ages 45 to 54 years Correlation Chart
The statistical analysis conducted on geographies consisting of 31,677,040 people shows no correlation between the proportion of Taiwanese and unemployment rate among population between the ages 45 and 54 in the United States with a correlation coefficient (R) of -0.001 and weighted average of 4.5%. Similarly, the statistical analysis conducted on geographies consisting of 36,494,727 people shows a substantial positive correlation between the proportion of Houma and unemployment rate among population between the ages 45 and 54 in the United States with a correlation coefficient (R) of 0.594 and weighted average of 5.6%, a difference of 26.5%.
Unemployment Among Ages 45 to 54 years Correlation Summary
| Measurement | Taiwanese | Houma |
| Minimum | 0.30% | 1.6% |
| Maximum | 8.2% | 15.2% |
| Range | 7.9% | 13.6% |
| Mean | 4.2% | 6.2% |
| Median | 4.1% | 5.3% |
| Interquartile 25% (IQ1) | 2.7% | 3.5% |
| Interquartile 75% (IQ3) | 5.5% | 7.6% |
| Interquartile Range (IQR) | 2.9% | 4.1% |
| Standard Deviation (Sample) | 1.9% | 3.7% |
| Standard Deviation (Population) | 1.9% | 3.6% |
Similar Demographics by Unemployment Among Ages 45 to 54 years
Demographics Similar to Taiwanese by Unemployment Among Ages 45 to 54 years
In terms of unemployment among ages 45 to 54 years, the demographic groups most similar to Taiwanese are Immigrants from Latvia (4.5%, a difference of 0.030%), Syrian (4.5%, a difference of 0.040%), Uruguayan (4.5%, a difference of 0.070%), Macedonian (4.5%, a difference of 0.080%), and Immigrants from Netherlands (4.4%, a difference of 0.11%).
| Demographics | Rating | Rank | Unemployment Among Ages 45 to 54 years |
| Lebanese | 81.9 /100 | #137 | Excellent 4.4% |
| Immigrants | Congo | 81.8 /100 | #138 | Excellent 4.4% |
| Immigrants | Kuwait | 81.7 /100 | #139 | Excellent 4.4% |
| Immigrants | Zaire | 80.7 /100 | #140 | Excellent 4.4% |
| Immigrants | Afghanistan | 79.6 /100 | #141 | Good 4.4% |
| Immigrants | Netherlands | 79.4 /100 | #142 | Good 4.4% |
| Macedonians | 79.0 /100 | #143 | Good 4.5% |
| Taiwanese | 77.9 /100 | #144 | Good 4.5% |
| Immigrants | Latvia | 77.5 /100 | #145 | Good 4.5% |
| Syrians | 77.3 /100 | #146 | Good 4.5% |
| Uruguayans | 76.9 /100 | #147 | Good 4.5% |
| Immigrants | Austria | 75.3 /100 | #148 | Good 4.5% |
| Costa Ricans | 75.3 /100 | #149 | Good 4.5% |
| Tsimshian | 74.6 /100 | #150 | Good 4.5% |
| Cypriots | 74.4 /100 | #151 | Good 4.5% |
Demographics Similar to Houma by Unemployment Among Ages 45 to 54 years
In terms of unemployment among ages 45 to 54 years, the demographic groups most similar to Houma are Immigrants from Guyana (5.6%, a difference of 0.10%), Immigrants from Dominica (5.6%, a difference of 0.30%), Guyanese (5.6%, a difference of 0.48%), British West Indian (5.7%, a difference of 0.63%), and Shoshone (5.6%, a difference of 0.81%).
| Demographics | Rating | Rank | Unemployment Among Ages 45 to 54 years |
| Immigrants | Barbados | 0.0 /100 | #310 | Tragic 5.5% |
| Chippewa | 0.0 /100 | #311 | Tragic 5.5% |
| Immigrants | Grenada | 0.0 /100 | #312 | Tragic 5.6% |
| Shoshone | 0.0 /100 | #313 | Tragic 5.6% |
| Guyanese | 0.0 /100 | #314 | Tragic 5.6% |
| Immigrants | Dominica | 0.0 /100 | #315 | Tragic 5.6% |
| Immigrants | Guyana | 0.0 /100 | #316 | Tragic 5.6% |
| Houma | 0.0 /100 | #317 | Tragic 5.6% |
| British West Indians | 0.0 /100 | #318 | Tragic 5.7% |
| Cape Verdeans | 0.0 /100 | #319 | Tragic 5.7% |
| Immigrants | St. Vincent and the Grenadines | 0.0 /100 | #320 | Tragic 5.7% |
| Yakama | 0.0 /100 | #321 | Tragic 5.7% |
| Immigrants | Azores | 0.0 /100 | #322 | Tragic 5.7% |
| Immigrants | Cabo Verde | 0.0 /100 | #323 | Tragic 5.9% |
| Natives/Alaskans | 0.0 /100 | #324 | Tragic 6.1% |