Immigrants from Argentina vs Choctaw Unemployment Among Youth under 25 years
COMPARE
Immigrants from Argentina
Choctaw
Unemployment Among Youth under 25 years
Unemployment Among Youth under 25 years Comparison
Immigrants from Argentina
Choctaw
11.4%
UNEMPLOYMENT AMONG YOUTH UNDER 25 YEARS
87.2/ 100
METRIC RATING
125th/ 347
METRIC RANK
12.1%
UNEMPLOYMENT AMONG YOUTH UNDER 25 YEARS
1.9/ 100
METRIC RATING
230th/ 347
METRIC RANK
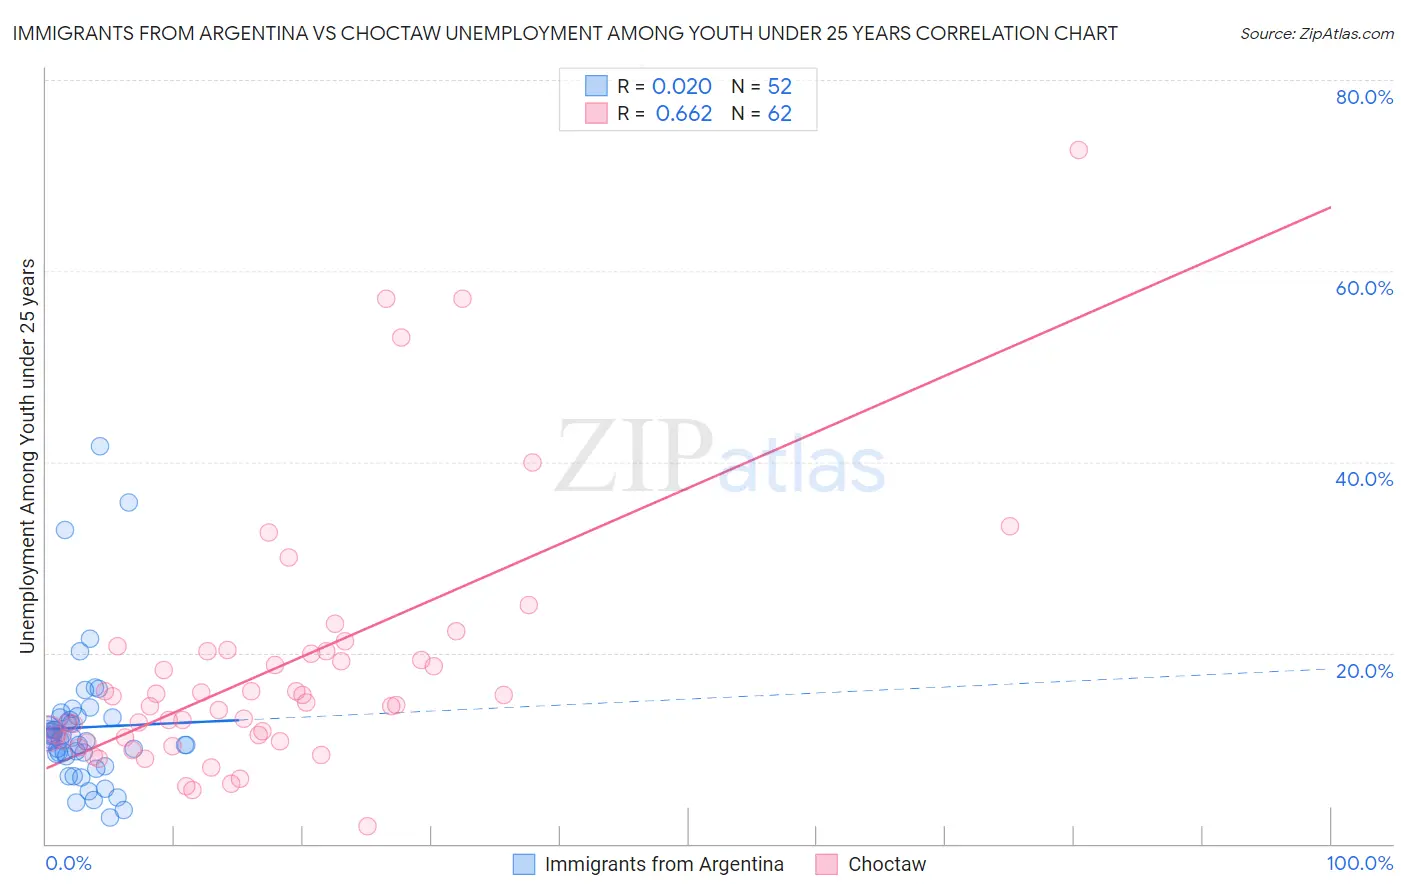
Immigrants from Argentina vs Choctaw Unemployment Among Youth under 25 years Correlation Chart
The statistical analysis conducted on geographies consisting of 262,817,431 people shows no correlation between the proportion of Immigrants from Argentina and unemployment rate among youth under the age of 25 in the United States with a correlation coefficient (R) of 0.020 and weighted average of 11.4%. Similarly, the statistical analysis conducted on geographies consisting of 266,328,025 people shows a significant positive correlation between the proportion of Choctaw and unemployment rate among youth under the age of 25 in the United States with a correlation coefficient (R) of 0.662 and weighted average of 12.1%, a difference of 6.1%.
Unemployment Among Youth under 25 years Correlation Summary
| Measurement | Immigrants from Argentina | Choctaw |
| Minimum | 2.7% | 1.8% |
| Maximum | 41.6% | 72.7% |
| Range | 38.9% | 70.9% |
| Mean | 12.2% | 18.2% |
| Median | 11.1% | 14.7% |
| Interquartile 25% (IQ1) | 9.3% | 10.9% |
| Interquartile 75% (IQ3) | 13.2% | 20.1% |
| Interquartile Range (IQR) | 4.0% | 9.2% |
| Standard Deviation (Sample) | 7.2% | 13.1% |
| Standard Deviation (Population) | 7.2% | 13.0% |
Similar Demographics by Unemployment Among Youth under 25 years
Demographics Similar to Immigrants from Argentina by Unemployment Among Youth under 25 years
In terms of unemployment among youth under 25 years, the demographic groups most similar to Immigrants from Argentina are Italian (11.4%, a difference of 0.0%), Canadian (11.4%, a difference of 0.050%), Basque (11.4%, a difference of 0.070%), Immigrants from Micronesia (11.4%, a difference of 0.090%), and Greek (11.4%, a difference of 0.090%).
| Demographics | Rating | Rank | Unemployment Among Youth under 25 years |
| Afghans | 89.7 /100 | #118 | Excellent 11.3% |
| Immigrants | Scotland | 89.2 /100 | #119 | Excellent 11.4% |
| Malaysians | 89.0 /100 | #120 | Excellent 11.4% |
| Slovaks | 88.9 /100 | #121 | Excellent 11.4% |
| Immigrants | Micronesia | 88.1 /100 | #122 | Excellent 11.4% |
| Basques | 87.8 /100 | #123 | Excellent 11.4% |
| Italians | 87.2 /100 | #124 | Excellent 11.4% |
| Immigrants | Argentina | 87.2 /100 | #125 | Excellent 11.4% |
| Canadians | 86.6 /100 | #126 | Excellent 11.4% |
| Greeks | 86.2 /100 | #127 | Excellent 11.4% |
| Immigrants | Hungary | 86.0 /100 | #128 | Excellent 11.4% |
| Turks | 85.8 /100 | #129 | Excellent 11.4% |
| Hungarians | 85.7 /100 | #130 | Excellent 11.4% |
| Immigrants | Spain | 84.6 /100 | #131 | Excellent 11.4% |
| Ethiopians | 83.2 /100 | #132 | Excellent 11.4% |
Demographics Similar to Choctaw by Unemployment Among Youth under 25 years
In terms of unemployment among youth under 25 years, the demographic groups most similar to Choctaw are Moroccan (12.1%, a difference of 0.050%), Immigrants from Fiji (12.1%, a difference of 0.060%), Immigrants from South America (12.1%, a difference of 0.10%), Immigrants from Belarus (12.1%, a difference of 0.17%), and South American Indian (12.1%, a difference of 0.19%).
| Demographics | Rating | Rank | Unemployment Among Youth under 25 years |
| Immigrants | Ireland | 3.5 /100 | #223 | Tragic 12.0% |
| Hawaiians | 3.5 /100 | #224 | Tragic 12.0% |
| Immigrants | Ukraine | 3.0 /100 | #225 | Tragic 12.0% |
| Immigrants | Israel | 2.6 /100 | #226 | Tragic 12.0% |
| Immigrants | Iran | 2.6 /100 | #227 | Tragic 12.0% |
| Immigrants | Fiji | 2.1 /100 | #228 | Tragic 12.1% |
| Moroccans | 2.1 /100 | #229 | Tragic 12.1% |
| Choctaw | 1.9 /100 | #230 | Tragic 12.1% |
| Immigrants | South America | 1.8 /100 | #231 | Tragic 12.1% |
| Immigrants | Belarus | 1.6 /100 | #232 | Tragic 12.1% |
| South American Indians | 1.6 /100 | #233 | Tragic 12.1% |
| Guatemalans | 1.4 /100 | #234 | Tragic 12.1% |
| Immigrants | Guatemala | 1.4 /100 | #235 | Tragic 12.1% |
| Immigrants | Immigrants | 1.3 /100 | #236 | Tragic 12.1% |
| Native Hawaiians | 1.3 /100 | #237 | Tragic 12.1% |