Scottish vs Immigrants from Norway Unemployment Among Ages 45 to 54 years
COMPARE
Scottish
Immigrants from Norway
Unemployment Among Ages 45 to 54 years
Unemployment Among Ages 45 to 54 years Comparison
Scottish
Immigrants from Norway
4.1%
UNEMPLOYMENT AMONG AGES 45 TO 54 YEARS
99.9/ 100
METRIC RATING
26th/ 347
METRIC RANK
4.7%
UNEMPLOYMENT AMONG AGES 45 TO 54 YEARS
4.8/ 100
METRIC RATING
225th/ 347
METRIC RANK
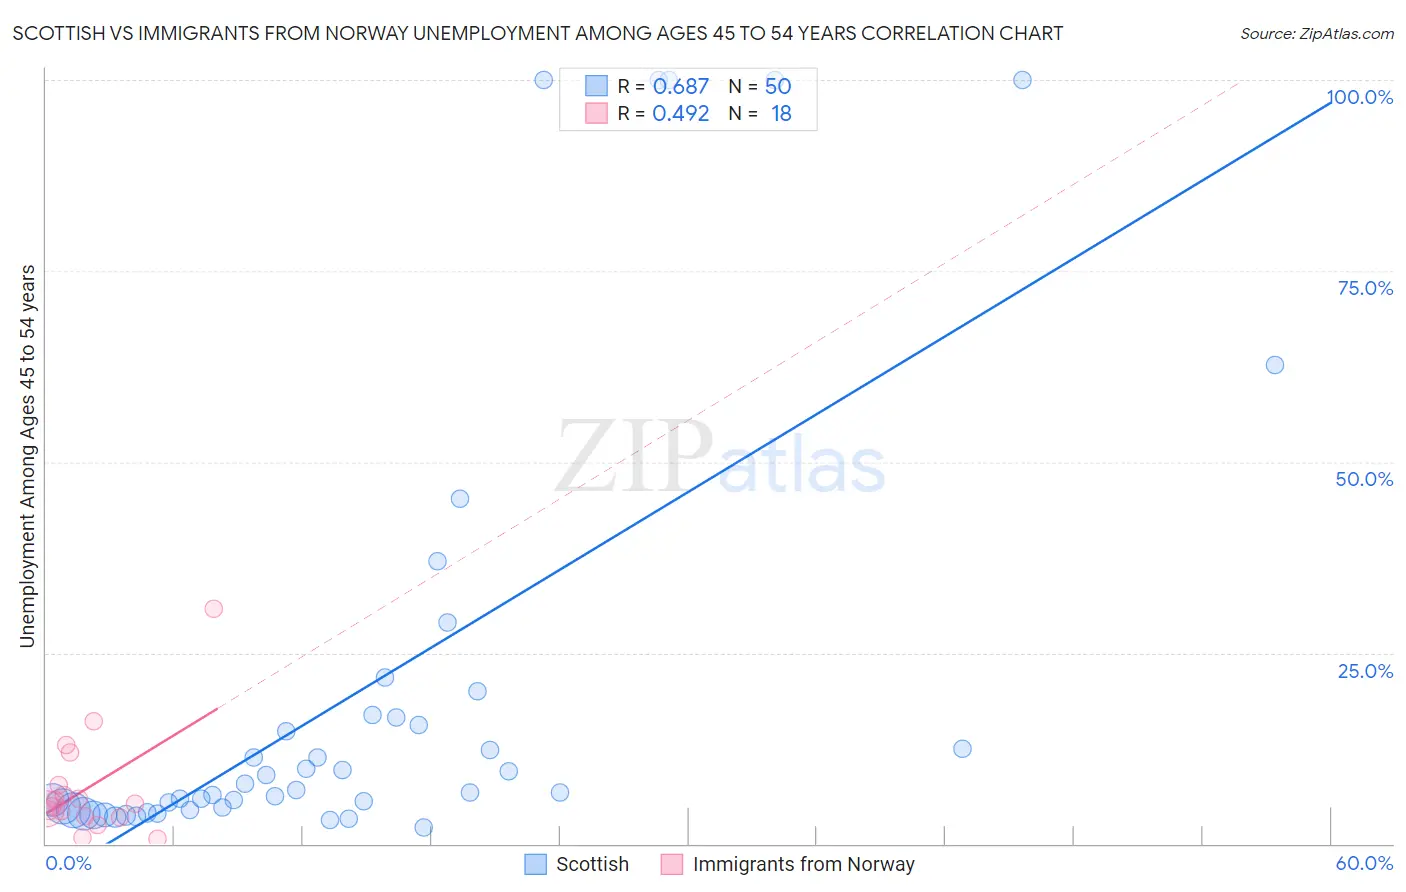
Scottish vs Immigrants from Norway Unemployment Among Ages 45 to 54 years Correlation Chart
The statistical analysis conducted on geographies consisting of 524,336,478 people shows a significant positive correlation between the proportion of Scottish and unemployment rate among population between the ages 45 and 54 in the United States with a correlation coefficient (R) of 0.687 and weighted average of 4.1%. Similarly, the statistical analysis conducted on geographies consisting of 115,484,514 people shows a moderate positive correlation between the proportion of Immigrants from Norway and unemployment rate among population between the ages 45 and 54 in the United States with a correlation coefficient (R) of 0.492 and weighted average of 4.7%, a difference of 13.5%.
Unemployment Among Ages 45 to 54 years Correlation Summary
| Measurement | Scottish | Immigrants from Norway |
| Minimum | 2.0% | 0.70% |
| Maximum | 100.0% | 30.8% |
| Range | 98.0% | 30.1% |
| Mean | 19.9% | 7.3% |
| Median | 6.8% | 5.1% |
| Interquartile 25% (IQ1) | 4.5% | 3.6% |
| Interquartile 75% (IQ3) | 16.6% | 7.7% |
| Interquartile Range (IQR) | 12.1% | 4.1% |
| Standard Deviation (Sample) | 29.2% | 7.1% |
| Standard Deviation (Population) | 28.9% | 6.9% |
Similar Demographics by Unemployment Among Ages 45 to 54 years
Demographics Similar to Scottish by Unemployment Among Ages 45 to 54 years
In terms of unemployment among ages 45 to 54 years, the demographic groups most similar to Scottish are Bolivian (4.1%, a difference of 0.0%), Carpatho Rusyn (4.1%, a difference of 0.12%), Immigrants from Moldova (4.1%, a difference of 0.48%), Welsh (4.1%, a difference of 0.54%), and Belgian (4.1%, a difference of 0.68%).
| Demographics | Rating | Rank | Unemployment Among Ages 45 to 54 years |
| Swiss | 100.0 /100 | #19 | Exceptional 4.1% |
| English | 100.0 /100 | #20 | Exceptional 4.1% |
| Europeans | 100.0 /100 | #21 | Exceptional 4.1% |
| Yugoslavians | 100.0 /100 | #22 | Exceptional 4.1% |
| Bulgarians | 100.0 /100 | #23 | Exceptional 4.1% |
| Carpatho Rusyns | 100.0 /100 | #24 | Exceptional 4.1% |
| Bolivians | 99.9 /100 | #25 | Exceptional 4.1% |
| Scottish | 99.9 /100 | #26 | Exceptional 4.1% |
| Immigrants | Moldova | 99.9 /100 | #27 | Exceptional 4.1% |
| Welsh | 99.9 /100 | #28 | Exceptional 4.1% |
| Belgians | 99.9 /100 | #29 | Exceptional 4.1% |
| British | 99.9 /100 | #30 | Exceptional 4.1% |
| Bhutanese | 99.9 /100 | #31 | Exceptional 4.2% |
| Slovenes | 99.9 /100 | #32 | Exceptional 4.2% |
| Immigrants | South Central Asia | 99.9 /100 | #33 | Exceptional 4.2% |
Demographics Similar to Immigrants from Norway by Unemployment Among Ages 45 to 54 years
In terms of unemployment among ages 45 to 54 years, the demographic groups most similar to Immigrants from Norway are Comanche (4.7%, a difference of 0.0%), Potawatomi (4.7%, a difference of 0.20%), Immigrants from Southern Europe (4.7%, a difference of 0.27%), Choctaw (4.7%, a difference of 0.30%), and Assyrian/Chaldean/Syriac (4.7%, a difference of 0.37%).
| Demographics | Rating | Rank | Unemployment Among Ages 45 to 54 years |
| Immigrants | Uganda | 7.1 /100 | #218 | Tragic 4.7% |
| Nigerians | 7.0 /100 | #219 | Tragic 4.7% |
| Guamanians/Chamorros | 6.8 /100 | #220 | Tragic 4.7% |
| Choctaw | 6.1 /100 | #221 | Tragic 4.7% |
| Immigrants | Southern Europe | 6.0 /100 | #222 | Tragic 4.7% |
| Potawatomi | 5.7 /100 | #223 | Tragic 4.7% |
| Comanche | 4.8 /100 | #224 | Tragic 4.7% |
| Immigrants | Norway | 4.8 /100 | #225 | Tragic 4.7% |
| Assyrians/Chaldeans/Syriacs | 3.5 /100 | #226 | Tragic 4.7% |
| Iraqis | 3.2 /100 | #227 | Tragic 4.7% |
| South American Indians | 3.1 /100 | #228 | Tragic 4.7% |
| Immigrants | Israel | 3.0 /100 | #229 | Tragic 4.7% |
| Japanese | 2.8 /100 | #230 | Tragic 4.7% |
| Immigrants | Ireland | 2.7 /100 | #231 | Tragic 4.7% |
| Ottawa | 2.7 /100 | #232 | Tragic 4.7% |