Immigrants from Africa vs Choctaw Unemployment Among Ages 55 to 59 years
COMPARE
Immigrants from Africa
Choctaw
Unemployment Among Ages 55 to 59 years
Unemployment Among Ages 55 to 59 years Comparison
Immigrants from Africa
Choctaw
4.8%
UNEMPLOYMENT AMONG AGES 55 TO 59 YEARS
64.2/ 100
METRIC RATING
162nd/ 347
METRIC RANK
5.0%
UNEMPLOYMENT AMONG AGES 55 TO 59 YEARS
1.3/ 100
METRIC RATING
237th/ 347
METRIC RANK
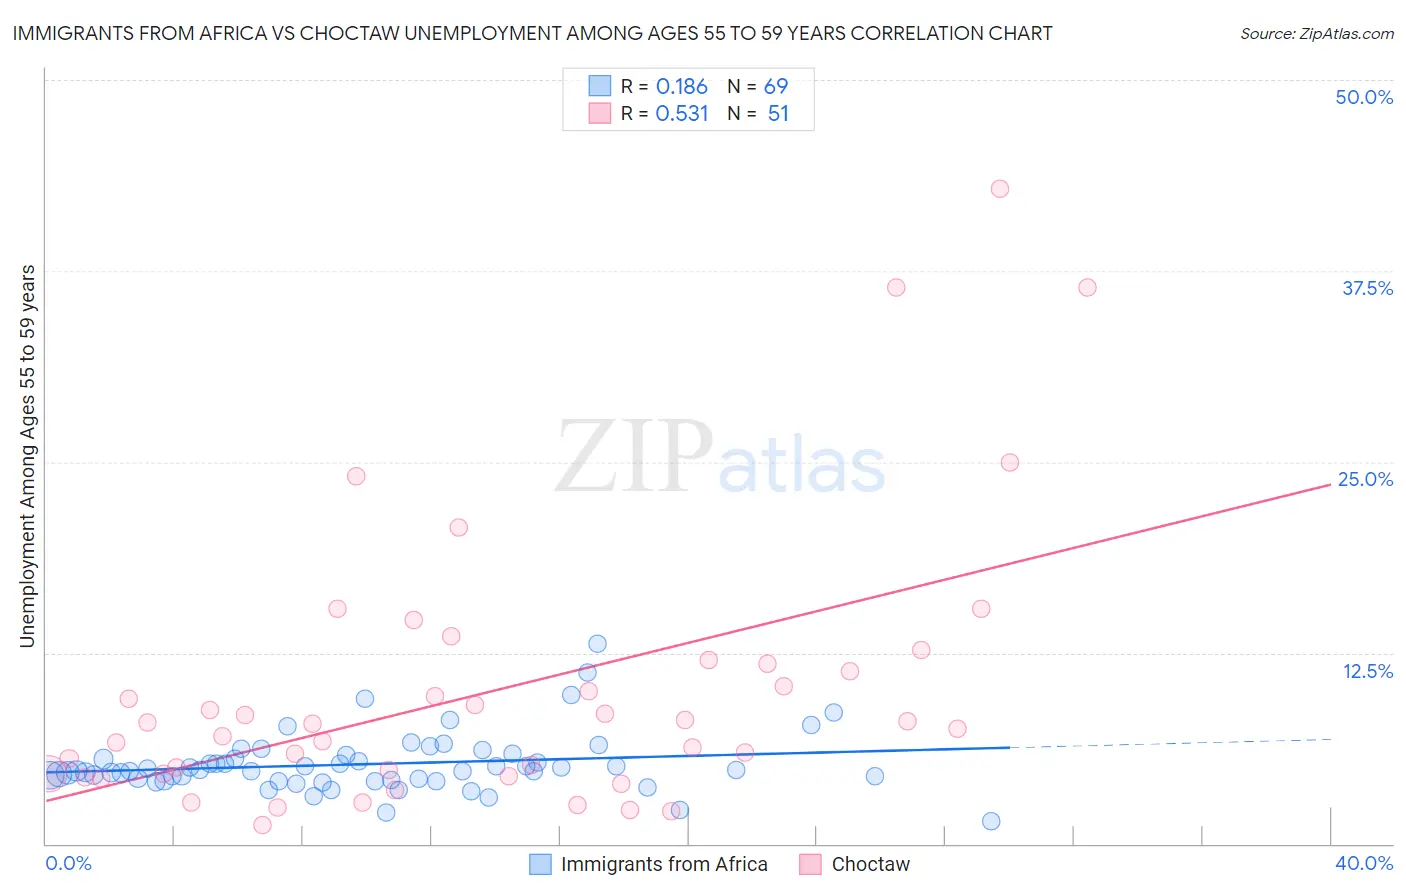
Immigrants from Africa vs Choctaw Unemployment Among Ages 55 to 59 years Correlation Chart
The statistical analysis conducted on geographies consisting of 429,302,225 people shows a poor positive correlation between the proportion of Immigrants from Africa and unemployment rate among population between the ages 55 and 59 in the United States with a correlation coefficient (R) of 0.186 and weighted average of 4.8%. Similarly, the statistical analysis conducted on geographies consisting of 252,000,407 people shows a substantial positive correlation between the proportion of Choctaw and unemployment rate among population between the ages 55 and 59 in the United States with a correlation coefficient (R) of 0.531 and weighted average of 5.0%, a difference of 5.0%.
Unemployment Among Ages 55 to 59 years Correlation Summary
| Measurement | Immigrants from Africa | Choctaw |
| Minimum | 1.5% | 1.2% |
| Maximum | 13.1% | 42.9% |
| Range | 11.6% | 41.7% |
| Mean | 5.2% | 10.0% |
| Median | 4.8% | 7.9% |
| Interquartile 25% (IQ1) | 4.2% | 4.6% |
| Interquartile 75% (IQ3) | 5.7% | 11.8% |
| Interquartile Range (IQR) | 1.5% | 7.2% |
| Standard Deviation (Sample) | 1.9% | 8.9% |
| Standard Deviation (Population) | 1.9% | 8.8% |
Similar Demographics by Unemployment Among Ages 55 to 59 years
Demographics Similar to Immigrants from Africa by Unemployment Among Ages 55 to 59 years
In terms of unemployment among ages 55 to 59 years, the demographic groups most similar to Immigrants from Africa are Korean (4.8%, a difference of 0.020%), Immigrants from Lebanon (4.8%, a difference of 0.020%), Immigrants from Nicaragua (4.8%, a difference of 0.040%), Chickasaw (4.8%, a difference of 0.040%), and American (4.8%, a difference of 0.040%).
| Demographics | Rating | Rank | Unemployment Among Ages 55 to 59 years |
| Immigrants | North Macedonia | 66.3 /100 | #155 | Good 4.8% |
| Italians | 66.2 /100 | #156 | Good 4.8% |
| Carpatho Rusyns | 66.0 /100 | #157 | Good 4.8% |
| Slovaks | 65.3 /100 | #158 | Good 4.8% |
| Immigrants | Nicaragua | 65.2 /100 | #159 | Good 4.8% |
| Chickasaw | 65.1 /100 | #160 | Good 4.8% |
| Koreans | 64.6 /100 | #161 | Good 4.8% |
| Immigrants | Africa | 64.2 /100 | #162 | Good 4.8% |
| Immigrants | Lebanon | 63.8 /100 | #163 | Good 4.8% |
| Americans | 63.3 /100 | #164 | Good 4.8% |
| Immigrants | France | 62.0 /100 | #165 | Good 4.8% |
| Potawatomi | 62.0 /100 | #166 | Good 4.8% |
| Immigrants | Western Europe | 60.4 /100 | #167 | Good 4.8% |
| Immigrants | Cambodia | 59.3 /100 | #168 | Average 4.8% |
| Immigrants | Sudan | 58.4 /100 | #169 | Average 4.8% |
Demographics Similar to Choctaw by Unemployment Among Ages 55 to 59 years
In terms of unemployment among ages 55 to 59 years, the demographic groups most similar to Choctaw are Immigrants from Albania (5.0%, a difference of 0.010%), Moroccan (5.0%, a difference of 0.020%), French American Indian (5.0%, a difference of 0.040%), Immigrants from Hong Kong (5.0%, a difference of 0.11%), and Immigrants from Costa Rica (5.0%, a difference of 0.16%).
| Demographics | Rating | Rank | Unemployment Among Ages 55 to 59 years |
| Immigrants | Syria | 2.7 /100 | #230 | Tragic 5.0% |
| Cherokee | 2.6 /100 | #231 | Tragic 5.0% |
| Albanians | 2.5 /100 | #232 | Tragic 5.0% |
| Immigrants | Immigrants | 2.3 /100 | #233 | Tragic 5.0% |
| Immigrants | Southern Europe | 1.8 /100 | #234 | Tragic 5.0% |
| Immigrants | Hong Kong | 1.4 /100 | #235 | Tragic 5.0% |
| Immigrants | Albania | 1.3 /100 | #236 | Tragic 5.0% |
| Choctaw | 1.3 /100 | #237 | Tragic 5.0% |
| Moroccans | 1.3 /100 | #238 | Tragic 5.0% |
| French American Indians | 1.2 /100 | #239 | Tragic 5.0% |
| Immigrants | Costa Rica | 1.1 /100 | #240 | Tragic 5.0% |
| Brazilians | 1.0 /100 | #241 | Tragic 5.0% |
| Liberians | 0.9 /100 | #242 | Tragic 5.1% |
| Hondurans | 0.7 /100 | #243 | Tragic 5.1% |
| Immigrants | Fiji | 0.7 /100 | #244 | Tragic 5.1% |