Cuban vs Choctaw Unemployment Among Ages 55 to 59 years
COMPARE
Cuban
Choctaw
Unemployment Among Ages 55 to 59 years
Unemployment Among Ages 55 to 59 years Comparison
Cubans
Choctaw
4.2%
UNEMPLOYMENT AMONG AGES 55 TO 59 YEARS
100.0/ 100
METRIC RATING
9th/ 347
METRIC RANK
5.0%
UNEMPLOYMENT AMONG AGES 55 TO 59 YEARS
1.3/ 100
METRIC RATING
237th/ 347
METRIC RANK
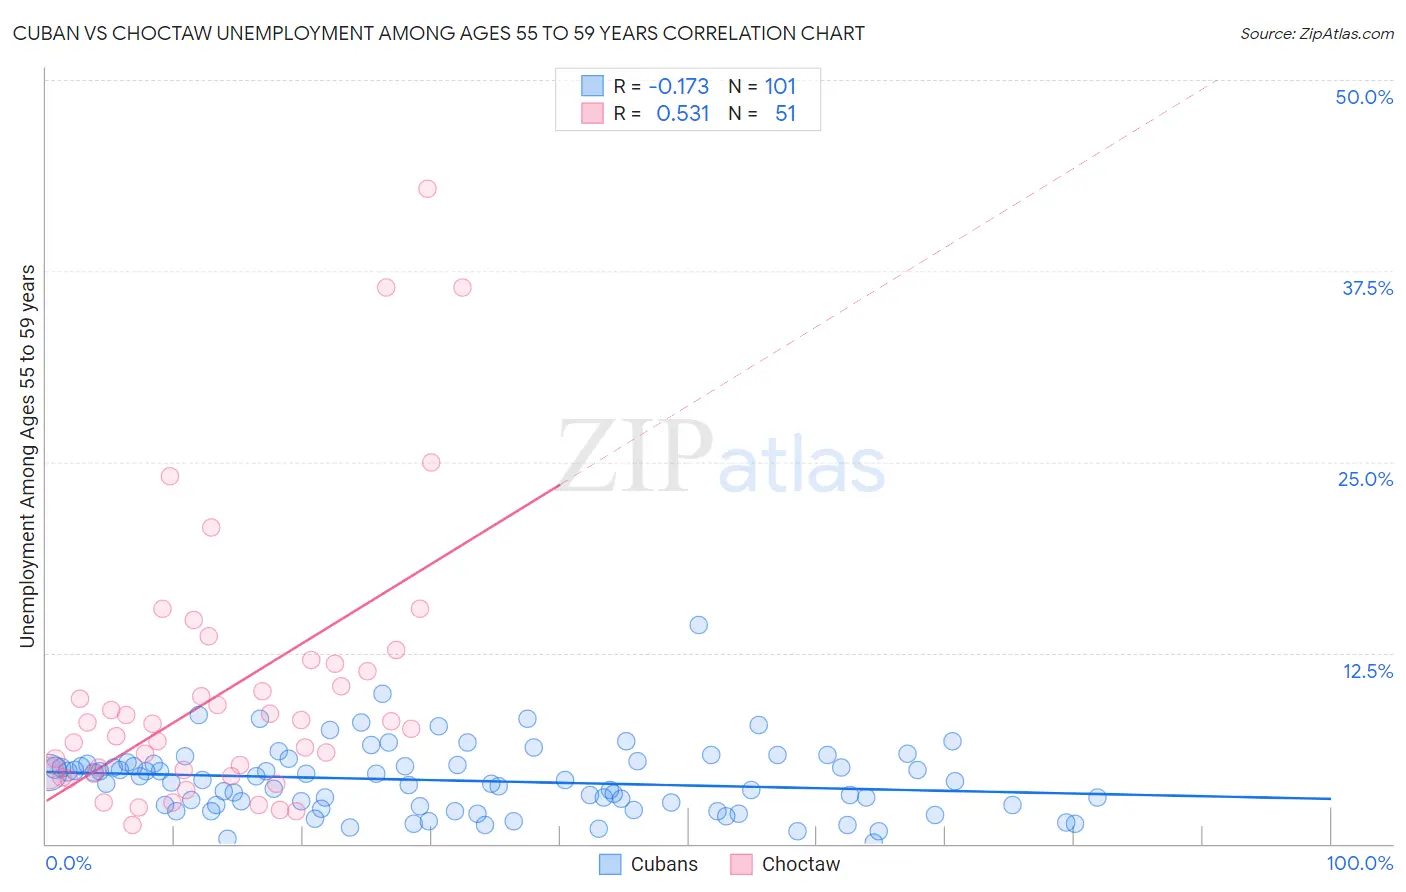
Cuban vs Choctaw Unemployment Among Ages 55 to 59 years Correlation Chart
The statistical analysis conducted on geographies consisting of 413,111,885 people shows a poor negative correlation between the proportion of Cubans and unemployment rate among population between the ages 55 and 59 in the United States with a correlation coefficient (R) of -0.173 and weighted average of 4.2%. Similarly, the statistical analysis conducted on geographies consisting of 252,000,407 people shows a substantial positive correlation between the proportion of Choctaw and unemployment rate among population between the ages 55 and 59 in the United States with a correlation coefficient (R) of 0.531 and weighted average of 5.0%, a difference of 18.6%.
Unemployment Among Ages 55 to 59 years Correlation Summary
| Measurement | Cuban | Choctaw |
| Minimum | 0.10% | 1.2% |
| Maximum | 14.3% | 42.9% |
| Range | 14.2% | 41.7% |
| Mean | 4.1% | 10.0% |
| Median | 4.1% | 7.9% |
| Interquartile 25% (IQ1) | 2.5% | 4.6% |
| Interquartile 75% (IQ3) | 5.2% | 11.8% |
| Interquartile Range (IQR) | 2.7% | 7.2% |
| Standard Deviation (Sample) | 2.3% | 8.9% |
| Standard Deviation (Population) | 2.3% | 8.8% |
Similar Demographics by Unemployment Among Ages 55 to 59 years
Demographics Similar to Cubans by Unemployment Among Ages 55 to 59 years
In terms of unemployment among ages 55 to 59 years, the demographic groups most similar to Cubans are Bolivian (4.2%, a difference of 0.12%), Zimbabwean (4.2%, a difference of 0.23%), Norwegian (4.2%, a difference of 0.80%), Tongan (4.3%, a difference of 0.98%), and Immigrants from Bolivia (4.2%, a difference of 1.4%).
| Demographics | Rating | Rank | Unemployment Among Ages 55 to 59 years |
| Immigrants | Cuba | 100.0 /100 | #2 | Exceptional 4.1% |
| Immigrants | Venezuela | 100.0 /100 | #3 | Exceptional 4.1% |
| Venezuelans | 100.0 /100 | #4 | Exceptional 4.2% |
| Immigrants | Bolivia | 100.0 /100 | #5 | Exceptional 4.2% |
| Norwegians | 100.0 /100 | #6 | Exceptional 4.2% |
| Zimbabweans | 100.0 /100 | #7 | Exceptional 4.2% |
| Bolivians | 100.0 /100 | #8 | Exceptional 4.2% |
| Cubans | 100.0 /100 | #9 | Exceptional 4.2% |
| Tongans | 100.0 /100 | #10 | Exceptional 4.3% |
| Immigrants | Congo | 100.0 /100 | #11 | Exceptional 4.3% |
| Danes | 100.0 /100 | #12 | Exceptional 4.3% |
| Indonesians | 100.0 /100 | #13 | Exceptional 4.3% |
| Immigrants | India | 100.0 /100 | #14 | Exceptional 4.3% |
| Bulgarians | 100.0 /100 | #15 | Exceptional 4.3% |
| Somalis | 100.0 /100 | #16 | Exceptional 4.4% |
Demographics Similar to Choctaw by Unemployment Among Ages 55 to 59 years
In terms of unemployment among ages 55 to 59 years, the demographic groups most similar to Choctaw are Immigrants from Albania (5.0%, a difference of 0.010%), Moroccan (5.0%, a difference of 0.020%), French American Indian (5.0%, a difference of 0.040%), Immigrants from Hong Kong (5.0%, a difference of 0.11%), and Immigrants from Costa Rica (5.0%, a difference of 0.16%).
| Demographics | Rating | Rank | Unemployment Among Ages 55 to 59 years |
| Immigrants | Syria | 2.7 /100 | #230 | Tragic 5.0% |
| Cherokee | 2.6 /100 | #231 | Tragic 5.0% |
| Albanians | 2.5 /100 | #232 | Tragic 5.0% |
| Immigrants | Immigrants | 2.3 /100 | #233 | Tragic 5.0% |
| Immigrants | Southern Europe | 1.8 /100 | #234 | Tragic 5.0% |
| Immigrants | Hong Kong | 1.4 /100 | #235 | Tragic 5.0% |
| Immigrants | Albania | 1.3 /100 | #236 | Tragic 5.0% |
| Choctaw | 1.3 /100 | #237 | Tragic 5.0% |
| Moroccans | 1.3 /100 | #238 | Tragic 5.0% |
| French American Indians | 1.2 /100 | #239 | Tragic 5.0% |
| Immigrants | Costa Rica | 1.1 /100 | #240 | Tragic 5.0% |
| Brazilians | 1.0 /100 | #241 | Tragic 5.0% |
| Liberians | 0.9 /100 | #242 | Tragic 5.1% |
| Hondurans | 0.7 /100 | #243 | Tragic 5.1% |
| Immigrants | Fiji | 0.7 /100 | #244 | Tragic 5.1% |