Hopi vs Choctaw Unemployment Among Ages 55 to 59 years
COMPARE
Hopi
Choctaw
Unemployment Among Ages 55 to 59 years
Unemployment Among Ages 55 to 59 years Comparison
Hopi
Choctaw
8.1%
UNEMPLOYMENT AMONG AGES 55 TO 59 YEARS
0.0/ 100
METRIC RATING
342nd/ 347
METRIC RANK
5.0%
UNEMPLOYMENT AMONG AGES 55 TO 59 YEARS
1.3/ 100
METRIC RATING
237th/ 347
METRIC RANK
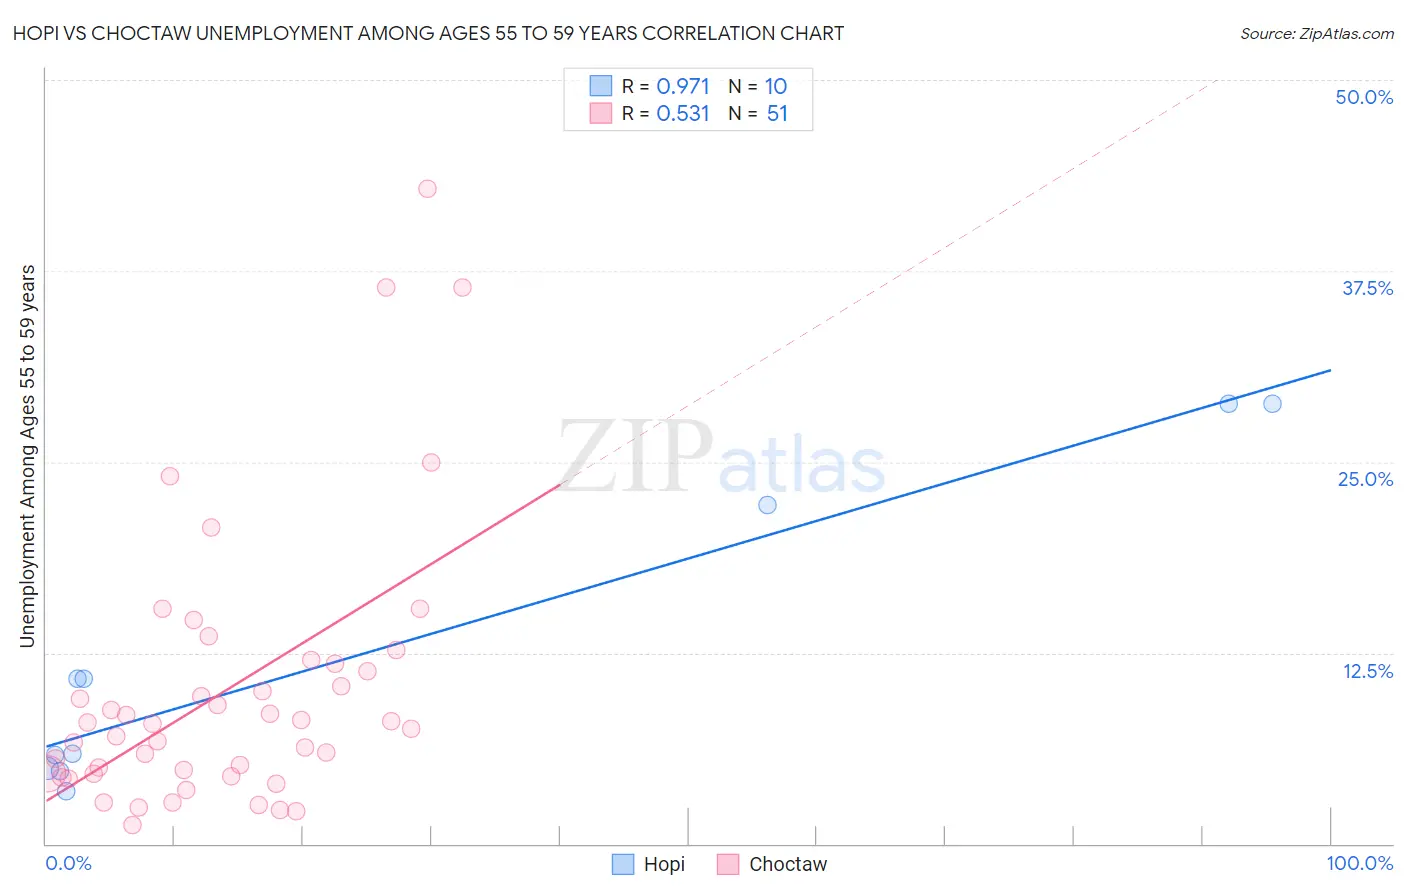
Hopi vs Choctaw Unemployment Among Ages 55 to 59 years Correlation Chart
The statistical analysis conducted on geographies consisting of 73,356,460 people shows a perfect positive correlation between the proportion of Hopi and unemployment rate among population between the ages 55 and 59 in the United States with a correlation coefficient (R) of 0.971 and weighted average of 8.1%. Similarly, the statistical analysis conducted on geographies consisting of 252,000,407 people shows a substantial positive correlation between the proportion of Choctaw and unemployment rate among population between the ages 55 and 59 in the United States with a correlation coefficient (R) of 0.531 and weighted average of 5.0%, a difference of 61.4%.
Unemployment Among Ages 55 to 59 years Correlation Summary
| Measurement | Hopi | Choctaw |
| Minimum | 3.5% | 1.2% |
| Maximum | 28.8% | 42.9% |
| Range | 25.3% | 41.7% |
| Mean | 12.6% | 10.0% |
| Median | 8.3% | 7.9% |
| Interquartile 25% (IQ1) | 4.9% | 4.6% |
| Interquartile 75% (IQ3) | 22.2% | 11.8% |
| Interquartile Range (IQR) | 17.3% | 7.2% |
| Standard Deviation (Sample) | 10.1% | 8.9% |
| Standard Deviation (Population) | 9.6% | 8.8% |
Similar Demographics by Unemployment Among Ages 55 to 59 years
Demographics Similar to Hopi by Unemployment Among Ages 55 to 59 years
In terms of unemployment among ages 55 to 59 years, the demographic groups most similar to Hopi are Yakama (8.9%, a difference of 10.0%), Shoshone (7.4%, a difference of 10.1%), Inupiat (9.0%, a difference of 11.3%), Alaskan Athabascan (7.1%, a difference of 13.8%), and Tohono O'odham (9.3%, a difference of 14.7%).
| Demographics | Rating | Rank | Unemployment Among Ages 55 to 59 years |
| Pima | 0.0 /100 | #333 | Tragic 6.6% |
| Pueblo | 0.0 /100 | #334 | Tragic 6.7% |
| Colville | 0.0 /100 | #335 | Tragic 6.7% |
| Navajo | 0.0 /100 | #336 | Tragic 6.7% |
| Paiute | 0.0 /100 | #337 | Tragic 6.8% |
| Immigrants | Yemen | 0.0 /100 | #338 | Tragic 6.9% |
| Puerto Ricans | 0.0 /100 | #339 | Tragic 7.0% |
| Alaskan Athabascans | 0.0 /100 | #340 | Tragic 7.1% |
| Shoshone | 0.0 /100 | #341 | Tragic 7.4% |
| Hopi | 0.0 /100 | #342 | Tragic 8.1% |
| Yakama | 0.0 /100 | #343 | Tragic 8.9% |
| Inupiat | 0.0 /100 | #344 | Tragic 9.0% |
| Tohono O'odham | 0.0 /100 | #345 | Tragic 9.3% |
| Menominee | 0.0 /100 | #346 | Tragic 10.5% |
| Yup'ik | 0.0 /100 | #347 | Tragic 13.9% |
Demographics Similar to Choctaw by Unemployment Among Ages 55 to 59 years
In terms of unemployment among ages 55 to 59 years, the demographic groups most similar to Choctaw are Immigrants from Albania (5.0%, a difference of 0.010%), Moroccan (5.0%, a difference of 0.020%), French American Indian (5.0%, a difference of 0.040%), Immigrants from Hong Kong (5.0%, a difference of 0.11%), and Immigrants from Costa Rica (5.0%, a difference of 0.16%).
| Demographics | Rating | Rank | Unemployment Among Ages 55 to 59 years |
| Immigrants | Syria | 2.7 /100 | #230 | Tragic 5.0% |
| Cherokee | 2.6 /100 | #231 | Tragic 5.0% |
| Albanians | 2.5 /100 | #232 | Tragic 5.0% |
| Immigrants | Immigrants | 2.3 /100 | #233 | Tragic 5.0% |
| Immigrants | Southern Europe | 1.8 /100 | #234 | Tragic 5.0% |
| Immigrants | Hong Kong | 1.4 /100 | #235 | Tragic 5.0% |
| Immigrants | Albania | 1.3 /100 | #236 | Tragic 5.0% |
| Choctaw | 1.3 /100 | #237 | Tragic 5.0% |
| Moroccans | 1.3 /100 | #238 | Tragic 5.0% |
| French American Indians | 1.2 /100 | #239 | Tragic 5.0% |
| Immigrants | Costa Rica | 1.1 /100 | #240 | Tragic 5.0% |
| Brazilians | 1.0 /100 | #241 | Tragic 5.0% |
| Liberians | 0.9 /100 | #242 | Tragic 5.1% |
| Hondurans | 0.7 /100 | #243 | Tragic 5.1% |
| Immigrants | Fiji | 0.7 /100 | #244 | Tragic 5.1% |