Icelander vs Okinawan Male Unemployment
COMPARE
Icelander
Okinawan
Male Unemployment
Male Unemployment Comparison
Icelanders
Okinawans
5.0%
MALE UNEMPLOYMENT
97.6/ 100
METRIC RATING
65th/ 347
METRIC RANK
5.1%
MALE UNEMPLOYMENT
94.7/ 100
METRIC RATING
90th/ 347
METRIC RANK
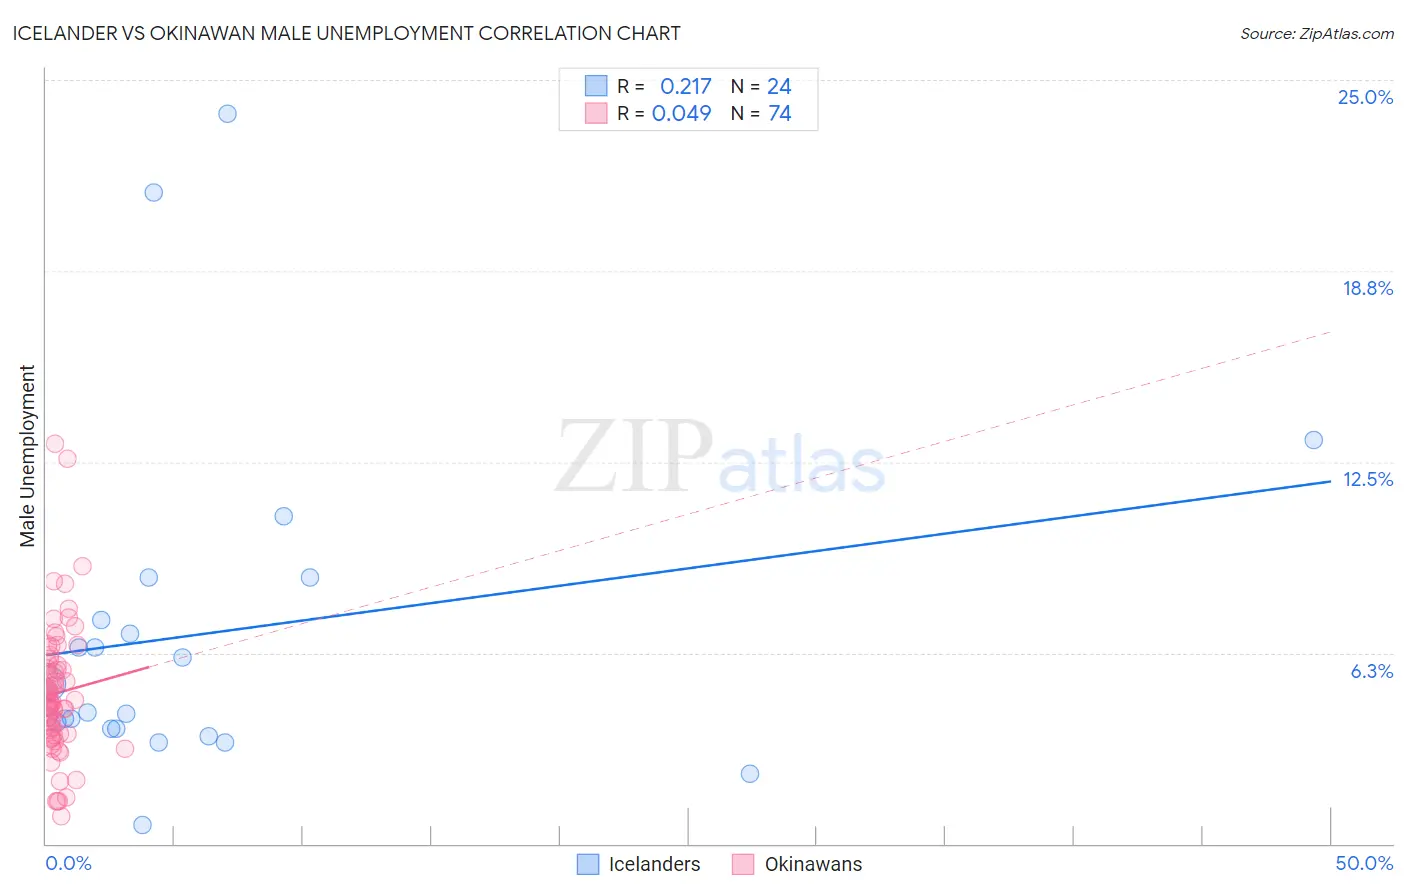
Icelander vs Okinawan Male Unemployment Correlation Chart
The statistical analysis conducted on geographies consisting of 159,328,705 people shows a weak positive correlation between the proportion of Icelanders and unemployment rate among males in the United States with a correlation coefficient (R) of 0.217 and weighted average of 5.0%. Similarly, the statistical analysis conducted on geographies consisting of 73,756,692 people shows no correlation between the proportion of Okinawans and unemployment rate among males in the United States with a correlation coefficient (R) of 0.049 and weighted average of 5.1%, a difference of 1.3%.
Male Unemployment Correlation Summary
| Measurement | Icelander | Okinawan |
| Minimum | 0.60% | 0.90% |
| Maximum | 23.9% | 13.1% |
| Range | 23.3% | 12.2% |
| Mean | 6.9% | 4.9% |
| Median | 4.8% | 4.7% |
| Interquartile 25% (IQ1) | 3.7% | 3.6% |
| Interquartile 75% (IQ3) | 8.0% | 5.9% |
| Interquartile Range (IQR) | 4.3% | 2.3% |
| Standard Deviation (Sample) | 5.6% | 2.2% |
| Standard Deviation (Population) | 5.5% | 2.2% |
Similar Demographics by Male Unemployment
Demographics Similar to Icelanders by Male Unemployment
In terms of male unemployment, the demographic groups most similar to Icelanders are Finnish (5.0%, a difference of 0.090%), Immigrants from Canada (5.0%, a difference of 0.11%), Australian (5.0%, a difference of 0.12%), Immigrants from Sweden (5.0%, a difference of 0.15%), and Celtic (5.0%, a difference of 0.16%).
| Demographics | Rating | Rank | Male Unemployment |
| Lithuanians | 98.5 /100 | #58 | Exceptional 5.0% |
| Immigrants | Netherlands | 98.3 /100 | #59 | Exceptional 5.0% |
| Immigrants | Argentina | 98.1 /100 | #60 | Exceptional 5.0% |
| Cambodians | 98.1 /100 | #61 | Exceptional 5.0% |
| Basques | 97.9 /100 | #62 | Exceptional 5.0% |
| Eastern Europeans | 97.9 /100 | #63 | Exceptional 5.0% |
| Celtics | 97.8 /100 | #64 | Exceptional 5.0% |
| Icelanders | 97.6 /100 | #65 | Exceptional 5.0% |
| Finns | 97.5 /100 | #66 | Exceptional 5.0% |
| Immigrants | Canada | 97.5 /100 | #67 | Exceptional 5.0% |
| Australians | 97.4 /100 | #68 | Exceptional 5.0% |
| Immigrants | Sweden | 97.4 /100 | #69 | Exceptional 5.0% |
| Whites/Caucasians | 97.3 /100 | #70 | Exceptional 5.0% |
| New Zealanders | 97.3 /100 | #71 | Exceptional 5.0% |
| Immigrants | South Africa | 97.1 /100 | #72 | Exceptional 5.0% |
Demographics Similar to Okinawans by Male Unemployment
In terms of male unemployment, the demographic groups most similar to Okinawans are Immigrants from Australia (5.1%, a difference of 0.010%), Immigrants from Sri Lanka (5.1%, a difference of 0.040%), Immigrants from Turkey (5.1%, a difference of 0.080%), Slavic (5.1%, a difference of 0.14%), and Immigrants from Serbia (5.1%, a difference of 0.14%).
| Demographics | Rating | Rank | Male Unemployment |
| Immigrants | Eritrea | 96.0 /100 | #83 | Exceptional 5.0% |
| Serbians | 95.7 /100 | #84 | Exceptional 5.1% |
| Immigrants | North Macedonia | 95.6 /100 | #85 | Exceptional 5.1% |
| Maltese | 95.5 /100 | #86 | Exceptional 5.1% |
| Immigrants | Romania | 95.4 /100 | #87 | Exceptional 5.1% |
| Immigrants | Sri Lanka | 94.9 /100 | #88 | Exceptional 5.1% |
| Immigrants | Australia | 94.7 /100 | #89 | Exceptional 5.1% |
| Okinawans | 94.7 /100 | #90 | Exceptional 5.1% |
| Immigrants | Turkey | 94.4 /100 | #91 | Exceptional 5.1% |
| Slavs | 94.2 /100 | #92 | Exceptional 5.1% |
| Immigrants | Serbia | 94.2 /100 | #93 | Exceptional 5.1% |
| Canadians | 94.1 /100 | #94 | Exceptional 5.1% |
| Italians | 93.8 /100 | #95 | Exceptional 5.1% |
| Asians | 93.7 /100 | #96 | Exceptional 5.1% |
| Immigrants | Spain | 93.4 /100 | #97 | Exceptional 5.1% |