Immigrants from Peru vs Navajo Female Unemployment
COMPARE
Immigrants from Peru
Navajo
Female Unemployment
Female Unemployment Comparison
Immigrants from Peru
Navajo
5.5%
FEMALE UNEMPLOYMENT
5.9/ 100
METRIC RATING
226th/ 347
METRIC RANK
7.3%
FEMALE UNEMPLOYMENT
0.0/ 100
METRIC RATING
337th/ 347
METRIC RANK
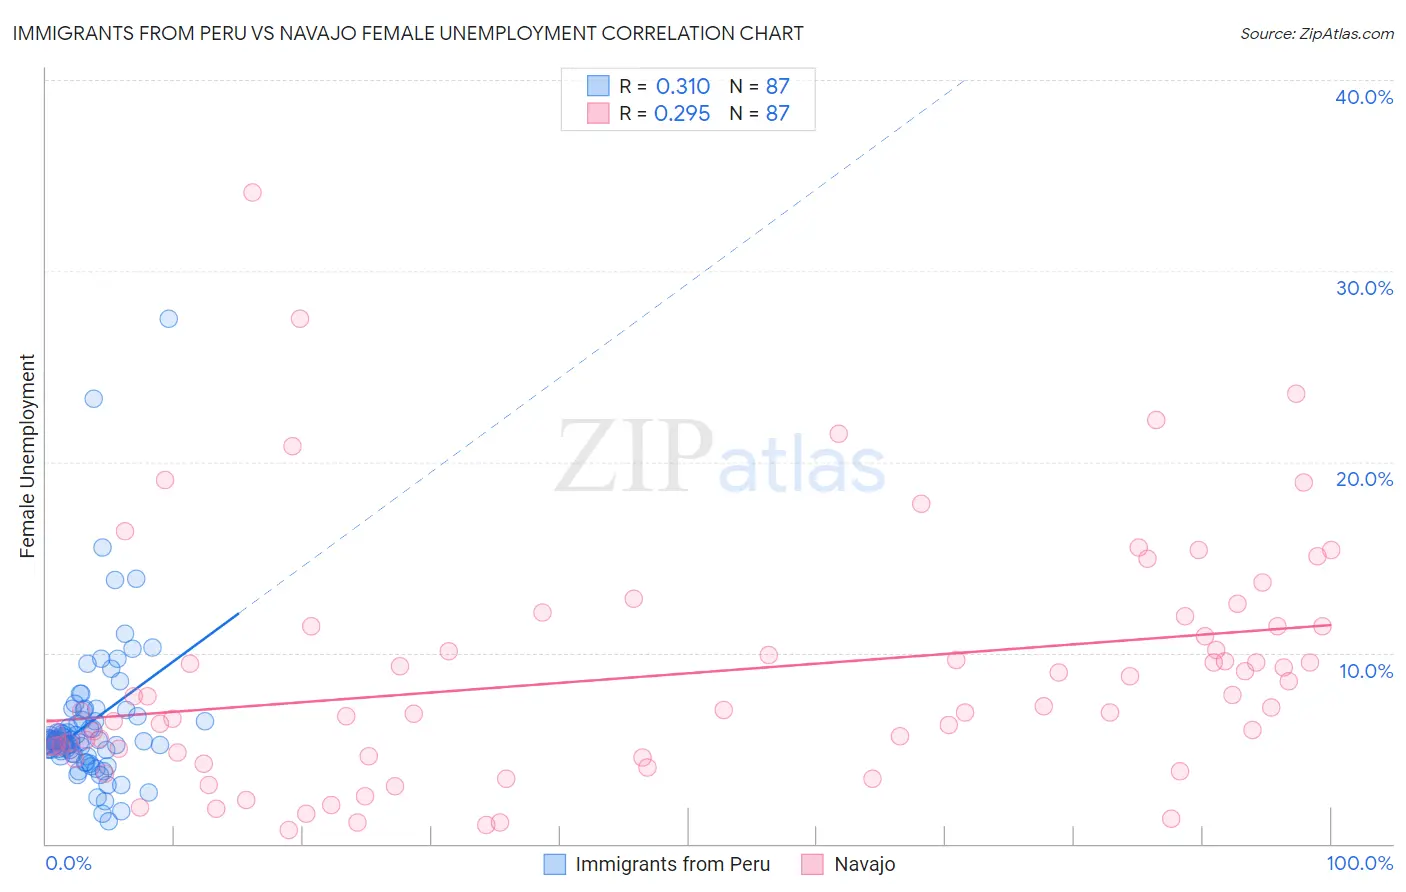
Immigrants from Peru vs Navajo Female Unemployment Correlation Chart
The statistical analysis conducted on geographies consisting of 328,076,387 people shows a mild positive correlation between the proportion of Immigrants from Peru and unemploymnet rate among females in the United States with a correlation coefficient (R) of 0.310 and weighted average of 5.5%. Similarly, the statistical analysis conducted on geographies consisting of 223,861,194 people shows a weak positive correlation between the proportion of Navajo and unemploymnet rate among females in the United States with a correlation coefficient (R) of 0.295 and weighted average of 7.3%, a difference of 33.1%.
Female Unemployment Correlation Summary
| Measurement | Immigrants from Peru | Navajo |
| Minimum | 1.2% | 0.70% |
| Maximum | 27.5% | 34.1% |
| Range | 26.3% | 33.4% |
| Mean | 6.3% | 8.9% |
| Median | 5.4% | 7.2% |
| Interquartile 25% (IQ1) | 4.7% | 4.6% |
| Interquartile 75% (IQ3) | 6.7% | 11.4% |
| Interquartile Range (IQR) | 2.0% | 6.8% |
| Standard Deviation (Sample) | 3.9% | 6.3% |
| Standard Deviation (Population) | 3.8% | 6.2% |
Similar Demographics by Female Unemployment
Demographics Similar to Immigrants from Peru by Female Unemployment
In terms of female unemployment, the demographic groups most similar to Immigrants from Peru are French American Indian (5.5%, a difference of 0.040%), Immigrants from Philippines (5.5%, a difference of 0.17%), Iraqi (5.5%, a difference of 0.27%), Delaware (5.5%, a difference of 0.30%), and Nicaraguan (5.5%, a difference of 0.31%).
| Demographics | Rating | Rank | Female Unemployment |
| South Americans | 8.6 /100 | #219 | Tragic 5.4% |
| Immigrants | Africa | 8.5 /100 | #220 | Tragic 5.4% |
| Brazilians | 7.3 /100 | #221 | Tragic 5.5% |
| Nicaraguans | 7.2 /100 | #222 | Tragic 5.5% |
| Delaware | 7.2 /100 | #223 | Tragic 5.5% |
| Iraqis | 7.1 /100 | #224 | Tragic 5.5% |
| French American Indians | 6.1 /100 | #225 | Tragic 5.5% |
| Immigrants | Peru | 5.9 /100 | #226 | Tragic 5.5% |
| Immigrants | Philippines | 5.3 /100 | #227 | Tragic 5.5% |
| Israelis | 4.8 /100 | #228 | Tragic 5.5% |
| Panamanians | 4.7 /100 | #229 | Tragic 5.5% |
| Immigrants | Uruguay | 4.7 /100 | #230 | Tragic 5.5% |
| Immigrants | Iraq | 3.9 /100 | #231 | Tragic 5.5% |
| Liberians | 3.9 /100 | #232 | Tragic 5.5% |
| Moroccans | 3.4 /100 | #233 | Tragic 5.5% |
Demographics Similar to Navajo by Female Unemployment
In terms of female unemployment, the demographic groups most similar to Navajo are Immigrants from Dominican Republic (7.2%, a difference of 0.94%), Dominican (7.2%, a difference of 1.6%), Immigrants from Armenia (7.1%, a difference of 3.0%), Menominee (7.0%, a difference of 3.5%), and Sioux (7.0%, a difference of 3.5%).
| Demographics | Rating | Rank | Female Unemployment |
| Yakama | 0.0 /100 | #330 | Tragic 6.7% |
| Paiute | 0.0 /100 | #331 | Tragic 6.8% |
| Sioux | 0.0 /100 | #332 | Tragic 7.0% |
| Menominee | 0.0 /100 | #333 | Tragic 7.0% |
| Immigrants | Armenia | 0.0 /100 | #334 | Tragic 7.1% |
| Dominicans | 0.0 /100 | #335 | Tragic 7.2% |
| Immigrants | Dominican Republic | 0.0 /100 | #336 | Tragic 7.2% |
| Navajo | 0.0 /100 | #337 | Tragic 7.3% |
| Tohono O'odham | 0.0 /100 | #338 | Tragic 7.7% |
| Immigrants | Yemen | 0.0 /100 | #339 | Tragic 7.8% |
| Hopi | 0.0 /100 | #340 | Tragic 8.1% |
| Inupiat | 0.0 /100 | #341 | Tragic 8.2% |
| Puerto Ricans | 0.0 /100 | #342 | Tragic 8.3% |
| Arapaho | 0.0 /100 | #343 | Tragic 8.8% |
| Pima | 0.0 /100 | #344 | Tragic 9.3% |