Spaniard vs U.S. Virgin Islander Unemployment Among Ages 45 to 54 years
COMPARE
Spaniard
U.S. Virgin Islander
Unemployment Among Ages 45 to 54 years
Unemployment Among Ages 45 to 54 years Comparison
Spaniards
U.S. Virgin Islanders
4.5%
UNEMPLOYMENT AMONG AGES 45 TO 54 YEARS
54.3/ 100
METRIC RATING
170th/ 347
METRIC RANK
5.0%
UNEMPLOYMENT AMONG AGES 45 TO 54 YEARS
0.0/ 100
METRIC RATING
274th/ 347
METRIC RANK
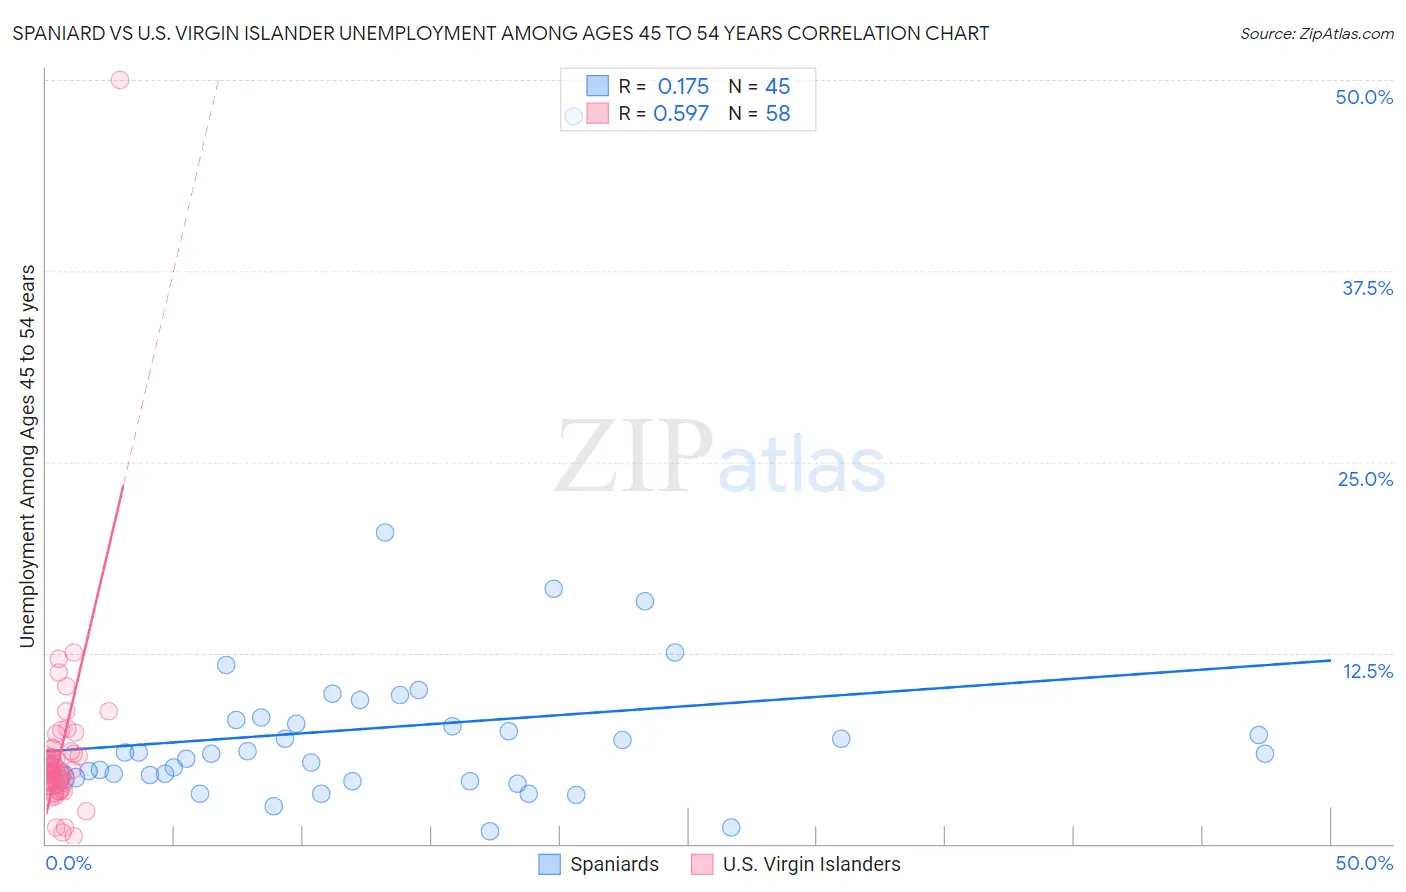
Spaniard vs U.S. Virgin Islander Unemployment Among Ages 45 to 54 years Correlation Chart
The statistical analysis conducted on geographies consisting of 429,338,631 people shows a poor positive correlation between the proportion of Spaniards and unemployment rate among population between the ages 45 and 54 in the United States with a correlation coefficient (R) of 0.175 and weighted average of 4.5%. Similarly, the statistical analysis conducted on geographies consisting of 87,109,924 people shows a substantial positive correlation between the proportion of U.S. Virgin Islanders and unemployment rate among population between the ages 45 and 54 in the United States with a correlation coefficient (R) of 0.597 and weighted average of 5.0%, a difference of 10.5%.
Unemployment Among Ages 45 to 54 years Correlation Summary
| Measurement | Spaniard | U.S. Virgin Islander |
| Minimum | 0.80% | 0.50% |
| Maximum | 47.6% | 50.0% |
| Range | 46.8% | 49.5% |
| Mean | 7.6% | 5.9% |
| Median | 5.9% | 4.7% |
| Interquartile 25% (IQ1) | 4.3% | 4.0% |
| Interquartile 75% (IQ3) | 8.2% | 5.9% |
| Interquartile Range (IQR) | 3.9% | 1.9% |
| Standard Deviation (Sample) | 7.2% | 6.4% |
| Standard Deviation (Population) | 7.2% | 6.3% |
Similar Demographics by Unemployment Among Ages 45 to 54 years
Demographics Similar to Spaniards by Unemployment Among Ages 45 to 54 years
In terms of unemployment among ages 45 to 54 years, the demographic groups most similar to Spaniards are Immigrants from Europe (4.5%, a difference of 0.020%), Immigrants from Egypt (4.5%, a difference of 0.020%), Egyptian (4.5%, a difference of 0.030%), Colombian (4.5%, a difference of 0.040%), and Immigrants from Brazil (4.5%, a difference of 0.10%).
| Demographics | Rating | Rank | Unemployment Among Ages 45 to 54 years |
| Bangladeshis | 59.7 /100 | #163 | Average 4.5% |
| Samoans | 58.5 /100 | #164 | Average 4.5% |
| Maltese | 57.9 /100 | #165 | Average 4.5% |
| Immigrants | Western Europe | 57.4 /100 | #166 | Average 4.5% |
| Immigrants | Brazil | 56.4 /100 | #167 | Average 4.5% |
| Immigrants | Europe | 54.7 /100 | #168 | Average 4.5% |
| Immigrants | Egypt | 54.7 /100 | #169 | Average 4.5% |
| Spaniards | 54.3 /100 | #170 | Average 4.5% |
| Egyptians | 53.6 /100 | #171 | Average 4.5% |
| Colombians | 53.3 /100 | #172 | Average 4.5% |
| Immigrants | Colombia | 52.0 /100 | #173 | Average 4.5% |
| Immigrants | Hungary | 50.0 /100 | #174 | Average 4.5% |
| Immigrants | France | 49.4 /100 | #175 | Average 4.5% |
| Puget Sound Salish | 49.1 /100 | #176 | Average 4.5% |
| Immigrants | Northern Africa | 49.0 /100 | #177 | Average 4.5% |
Demographics Similar to U.S. Virgin Islanders by Unemployment Among Ages 45 to 54 years
In terms of unemployment among ages 45 to 54 years, the demographic groups most similar to U.S. Virgin Islanders are Immigrants from Latin America (5.0%, a difference of 0.050%), Bermudan (5.0%, a difference of 0.050%), Immigrants from Central America (5.0%, a difference of 0.22%), Cajun (5.0%, a difference of 0.39%), and Immigrants from Ghana (5.0%, a difference of 0.46%).
| Demographics | Rating | Rank | Unemployment Among Ages 45 to 54 years |
| Bahamians | 0.0 /100 | #267 | Tragic 4.9% |
| Immigrants | Uzbekistan | 0.0 /100 | #268 | Tragic 4.9% |
| Somalis | 0.0 /100 | #269 | Tragic 5.0% |
| Immigrants | Ghana | 0.0 /100 | #270 | Tragic 5.0% |
| Cajuns | 0.0 /100 | #271 | Tragic 5.0% |
| Immigrants | Central America | 0.0 /100 | #272 | Tragic 5.0% |
| Immigrants | Latin America | 0.0 /100 | #273 | Tragic 5.0% |
| U.S. Virgin Islanders | 0.0 /100 | #274 | Tragic 5.0% |
| Bermudans | 0.0 /100 | #275 | Tragic 5.0% |
| French American Indians | 0.0 /100 | #276 | Tragic 5.0% |
| Immigrants | Mexico | 0.0 /100 | #277 | Tragic 5.0% |
| Dutch West Indians | 0.0 /100 | #278 | Tragic 5.0% |
| Nepalese | 0.0 /100 | #279 | Tragic 5.0% |
| Blackfeet | 0.0 /100 | #280 | Tragic 5.1% |
| Spanish American Indians | 0.0 /100 | #281 | Tragic 5.1% |