Hopi vs Honduran Unemployment Among Women with Children Under 6 years
COMPARE
Hopi
Honduran
Unemployment Among Women with Children Under 6 years
Unemployment Among Women with Children Under 6 years Comparison
Hopi
Hondurans
16.8%
UNEMPLOYMENT AMONG WOMEN WITH CHILDREN UNDER 6 YEARS
0.0/ 100
METRIC RATING
344th/ 347
METRIC RANK
8.4%
UNEMPLOYMENT AMONG WOMEN WITH CHILDREN UNDER 6 YEARS
0.3/ 100
METRIC RATING
264th/ 347
METRIC RANK
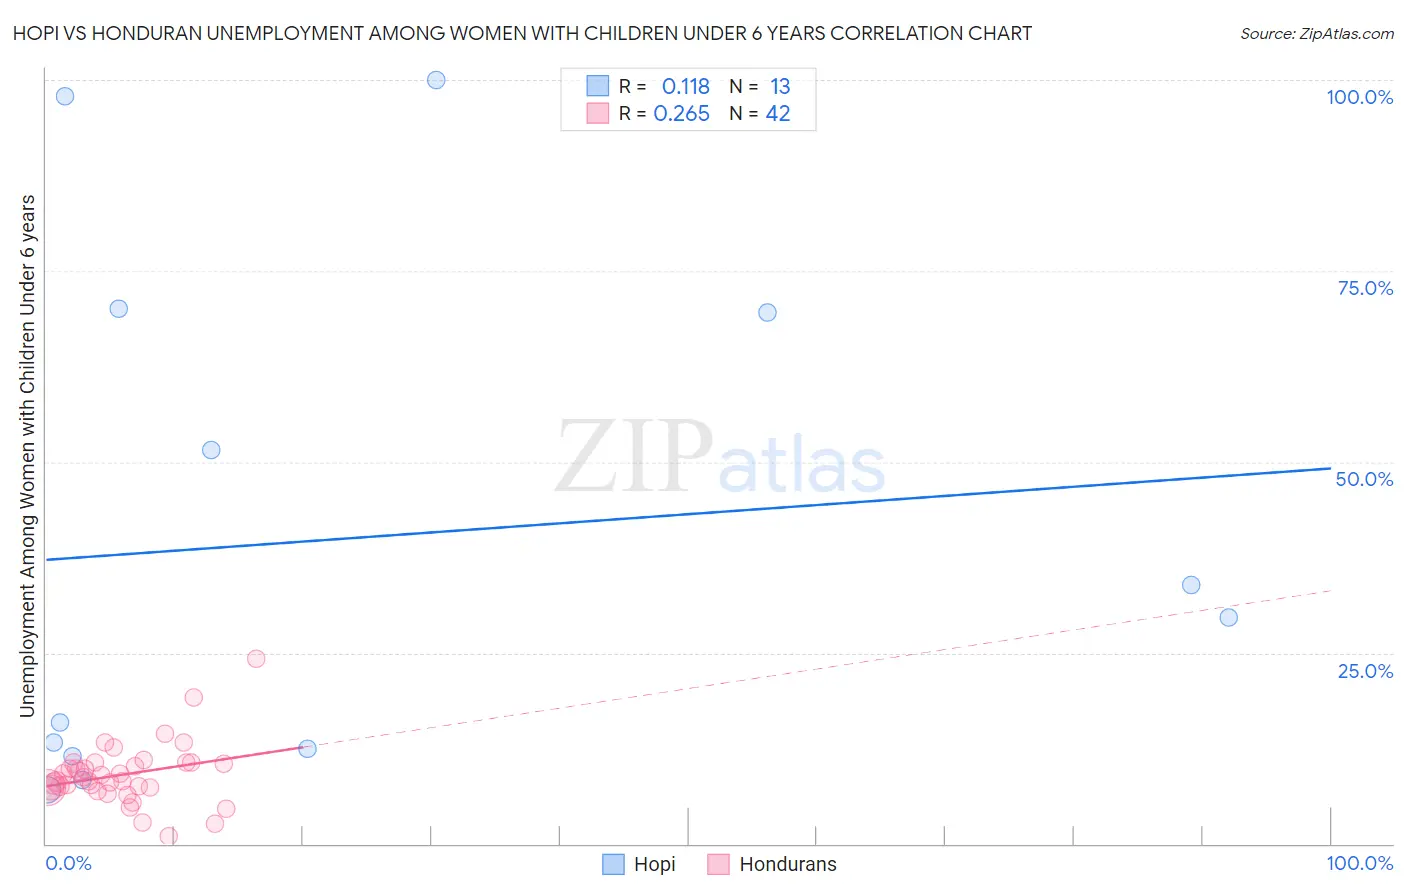
Hopi vs Honduran Unemployment Among Women with Children Under 6 years Correlation Chart
The statistical analysis conducted on geographies consisting of 69,549,010 people shows a poor positive correlation between the proportion of Hopi and unemployment rate among women with children under the age of 6 in the United States with a correlation coefficient (R) of 0.118 and weighted average of 16.8%. Similarly, the statistical analysis conducted on geographies consisting of 285,811,786 people shows a weak positive correlation between the proportion of Hondurans and unemployment rate among women with children under the age of 6 in the United States with a correlation coefficient (R) of 0.265 and weighted average of 8.4%, a difference of 99.8%.
Unemployment Among Women with Children Under 6 years Correlation Summary
| Measurement | Hopi | Honduran |
| Minimum | 7.0% | 1.0% |
| Maximum | 100.0% | 24.3% |
| Range | 93.0% | 23.3% |
| Mean | 40.1% | 9.0% |
| Median | 29.7% | 8.5% |
| Interquartile 25% (IQ1) | 12.0% | 7.3% |
| Interquartile 75% (IQ3) | 69.8% | 10.6% |
| Interquartile Range (IQR) | 57.8% | 3.2% |
| Standard Deviation (Sample) | 34.1% | 4.0% |
| Standard Deviation (Population) | 32.8% | 4.0% |
Similar Demographics by Unemployment Among Women with Children Under 6 years
Demographics Similar to Hopi by Unemployment Among Women with Children Under 6 years
In terms of unemployment among women with children under 6 years, the demographic groups most similar to Hopi are Inupiat (17.7%, a difference of 5.6%), Arapaho (19.0%, a difference of 13.5%), Crow (14.6%, a difference of 14.6%), Yuman (14.6%, a difference of 14.7%), and Lumbee (13.8%, a difference of 21.6%).
| Demographics | Rating | Rank | Unemployment Among Women with Children Under 6 years |
| Natives/Alaskans | 0.0 /100 | #333 | Tragic 11.5% |
| Apache | 0.0 /100 | #334 | Tragic 12.3% |
| Puerto Ricans | 0.0 /100 | #335 | Tragic 12.5% |
| Shoshone | 0.0 /100 | #336 | Tragic 13.2% |
| Chippewa | 0.0 /100 | #337 | Tragic 13.3% |
| Pima | 0.0 /100 | #338 | Tragic 13.4% |
| Navajo | 0.0 /100 | #339 | Tragic 13.5% |
| Immigrants | Yemen | 0.0 /100 | #340 | Tragic 13.5% |
| Lumbee | 0.0 /100 | #341 | Tragic 13.8% |
| Yuman | 0.0 /100 | #342 | Tragic 14.6% |
| Crow | 0.0 /100 | #343 | Tragic 14.6% |
| Hopi | 0.0 /100 | #344 | Tragic 16.8% |
| Inupiat | 0.0 /100 | #345 | Tragic 17.7% |
| Arapaho | 0.0 /100 | #346 | Tragic 19.0% |
| Yup'ik | 0.0 /100 | #347 | Tragic 21.1% |
Demographics Similar to Hondurans by Unemployment Among Women with Children Under 6 years
In terms of unemployment among women with children under 6 years, the demographic groups most similar to Hondurans are Scotch-Irish (8.4%, a difference of 0.020%), West Indian (8.4%, a difference of 0.050%), French Canadian (8.4%, a difference of 0.050%), Immigrants from Honduras (8.4%, a difference of 0.050%), and Immigrants from Liberia (8.4%, a difference of 0.060%).
| Demographics | Rating | Rank | Unemployment Among Women with Children Under 6 years |
| British West Indians | 0.5 /100 | #257 | Tragic 8.3% |
| Immigrants | Ghana | 0.5 /100 | #258 | Tragic 8.3% |
| Barbadians | 0.4 /100 | #259 | Tragic 8.3% |
| Whites/Caucasians | 0.3 /100 | #260 | Tragic 8.4% |
| Immigrants | Liberia | 0.3 /100 | #261 | Tragic 8.4% |
| West Indians | 0.3 /100 | #262 | Tragic 8.4% |
| Scotch-Irish | 0.3 /100 | #263 | Tragic 8.4% |
| Hondurans | 0.3 /100 | #264 | Tragic 8.4% |
| French Canadians | 0.3 /100 | #265 | Tragic 8.4% |
| Immigrants | Honduras | 0.3 /100 | #266 | Tragic 8.4% |
| Belizeans | 0.2 /100 | #267 | Tragic 8.4% |
| Sub-Saharan Africans | 0.2 /100 | #268 | Tragic 8.4% |
| Immigrants | Haiti | 0.2 /100 | #269 | Tragic 8.4% |
| Immigrants | Senegal | 0.2 /100 | #270 | Tragic 8.5% |
| Immigrants | Congo | 0.2 /100 | #271 | Tragic 8.5% |