Hopi vs Ecuadorian 11th Grade
COMPARE
Hopi
Ecuadorian
11th Grade
11th Grade Comparison
Hopi
Ecuadorians
91.7%
11TH GRADE
2.5/ 100
METRIC RATING
239th/ 347
METRIC RANK
89.6%
11TH GRADE
0.0/ 100
METRIC RATING
306th/ 347
METRIC RANK
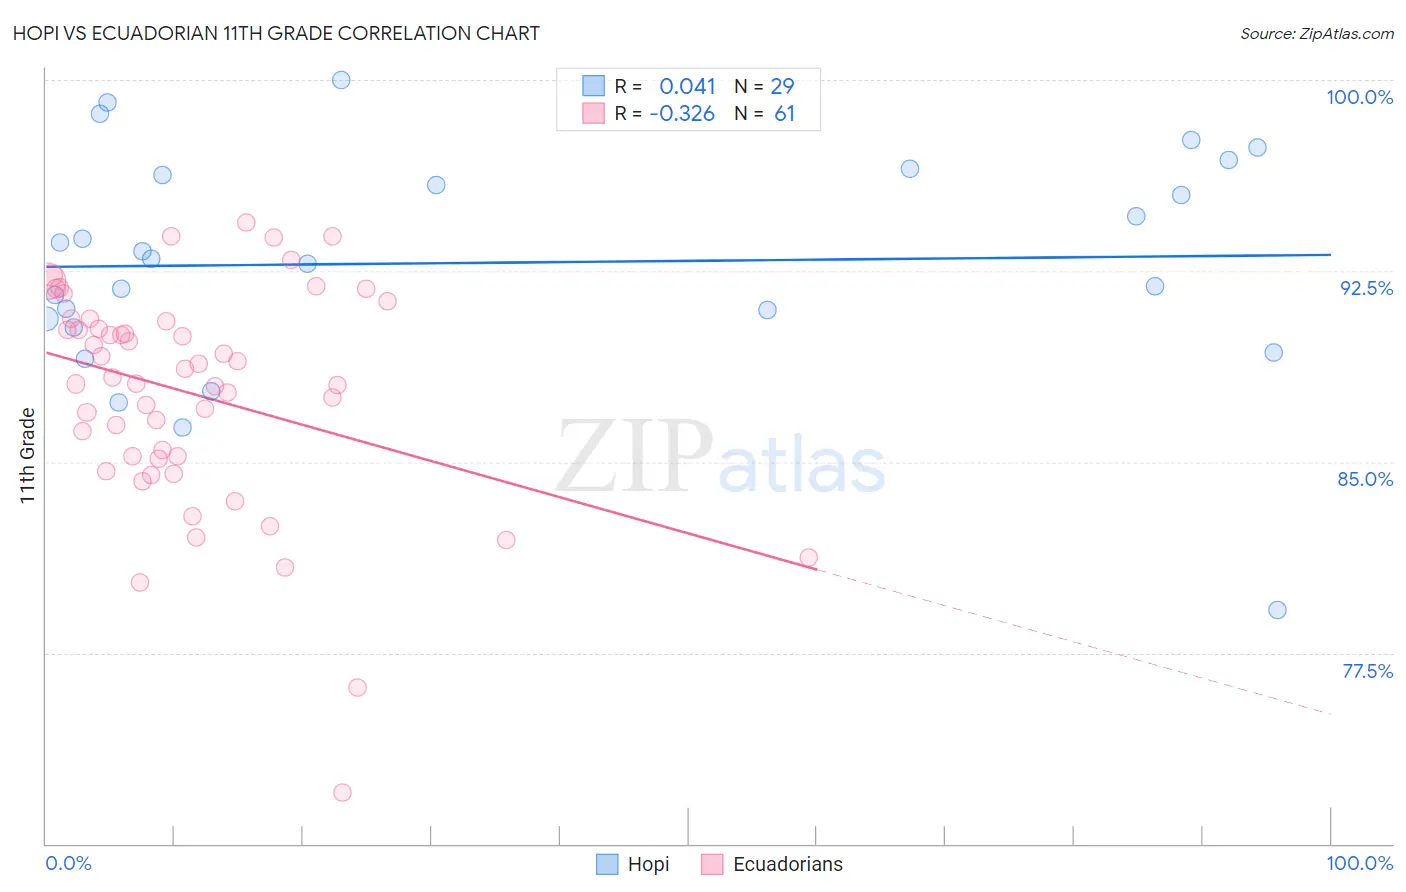
Hopi vs Ecuadorian 11th Grade Correlation Chart
The statistical analysis conducted on geographies consisting of 74,739,957 people shows no correlation between the proportion of Hopi and percentage of population with at least 11th grade education in the United States with a correlation coefficient (R) of 0.041 and weighted average of 91.7%. Similarly, the statistical analysis conducted on geographies consisting of 317,753,005 people shows a mild negative correlation between the proportion of Ecuadorians and percentage of population with at least 11th grade education in the United States with a correlation coefficient (R) of -0.326 and weighted average of 89.6%, a difference of 2.4%.
11th Grade Correlation Summary
| Measurement | Hopi | Ecuadorian |
| Minimum | 79.2% | 72.0% |
| Maximum | 100.0% | 94.4% |
| Range | 20.8% | 22.4% |
| Mean | 92.8% | 87.7% |
| Median | 93.0% | 88.3% |
| Interquartile 25% (IQ1) | 90.5% | 85.2% |
| Interquartile 75% (IQ3) | 96.4% | 90.6% |
| Interquartile Range (IQR) | 5.9% | 5.4% |
| Standard Deviation (Sample) | 4.5% | 4.3% |
| Standard Deviation (Population) | 4.4% | 4.3% |
Similar Demographics by 11th Grade
Demographics Similar to Hopi by 11th Grade
In terms of 11th grade, the demographic groups most similar to Hopi are Comanche (91.7%, a difference of 0.0%), Subsaharan African (91.7%, a difference of 0.030%), Colombian (91.7%, a difference of 0.030%), Immigrants from Bolivia (91.7%, a difference of 0.030%), and Armenian (91.7%, a difference of 0.040%).
| Demographics | Rating | Rank | 11th Grade |
| Uruguayans | 3.5 /100 | #232 | Tragic 91.8% |
| Cheyenne | 3.3 /100 | #233 | Tragic 91.8% |
| Armenians | 2.9 /100 | #234 | Tragic 91.7% |
| Sub-Saharan Africans | 2.9 /100 | #235 | Tragic 91.7% |
| Colombians | 2.8 /100 | #236 | Tragic 91.7% |
| Immigrants | Bolivia | 2.8 /100 | #237 | Tragic 91.7% |
| Comanche | 2.6 /100 | #238 | Tragic 91.7% |
| Hopi | 2.5 /100 | #239 | Tragic 91.7% |
| South Americans | 2.0 /100 | #240 | Tragic 91.6% |
| Bahamians | 1.8 /100 | #241 | Tragic 91.6% |
| Immigrants | Middle Africa | 1.6 /100 | #242 | Tragic 91.6% |
| Immigrants | Thailand | 1.4 /100 | #243 | Tragic 91.6% |
| Senegalese | 1.4 /100 | #244 | Tragic 91.6% |
| Africans | 1.3 /100 | #245 | Tragic 91.5% |
| Seminole | 1.2 /100 | #246 | Tragic 91.5% |
Demographics Similar to Ecuadorians by 11th Grade
In terms of 11th grade, the demographic groups most similar to Ecuadorians are Immigrants from Cambodia (89.6%, a difference of 0.050%), Immigrants from Dominica (89.5%, a difference of 0.050%), Nepalese (89.5%, a difference of 0.070%), Immigrants from Bangladesh (89.5%, a difference of 0.10%), and Yaqui (89.5%, a difference of 0.11%).
| Demographics | Rating | Rank | 11th Grade |
| Japanese | 0.0 /100 | #299 | Tragic 89.9% |
| Immigrants | Haiti | 0.0 /100 | #300 | Tragic 89.9% |
| Guyanese | 0.0 /100 | #301 | Tragic 89.9% |
| Immigrants | Guyana | 0.0 /100 | #302 | Tragic 89.7% |
| Immigrants | Immigrants | 0.0 /100 | #303 | Tragic 89.7% |
| Yuman | 0.0 /100 | #304 | Tragic 89.7% |
| Immigrants | Cambodia | 0.0 /100 | #305 | Tragic 89.6% |
| Ecuadorians | 0.0 /100 | #306 | Tragic 89.6% |
| Immigrants | Dominica | 0.0 /100 | #307 | Tragic 89.5% |
| Nepalese | 0.0 /100 | #308 | Tragic 89.5% |
| Immigrants | Bangladesh | 0.0 /100 | #309 | Tragic 89.5% |
| Yaqui | 0.0 /100 | #310 | Tragic 89.5% |
| Vietnamese | 0.0 /100 | #311 | Tragic 89.4% |
| Immigrants | Portugal | 0.0 /100 | #312 | Tragic 89.3% |
| Immigrants | Caribbean | 0.0 /100 | #313 | Tragic 89.1% |