Hopi vs Samoan Unemployment Among Ages 55 to 59 years
COMPARE
Hopi
Samoan
Unemployment Among Ages 55 to 59 years
Unemployment Among Ages 55 to 59 years Comparison
Hopi
Samoans
8.1%
UNEMPLOYMENT AMONG AGES 55 TO 59 YEARS
0.0/ 100
METRIC RATING
342nd/ 347
METRIC RANK
4.8%
UNEMPLOYMENT AMONG AGES 55 TO 59 YEARS
47.1/ 100
METRIC RATING
176th/ 347
METRIC RANK
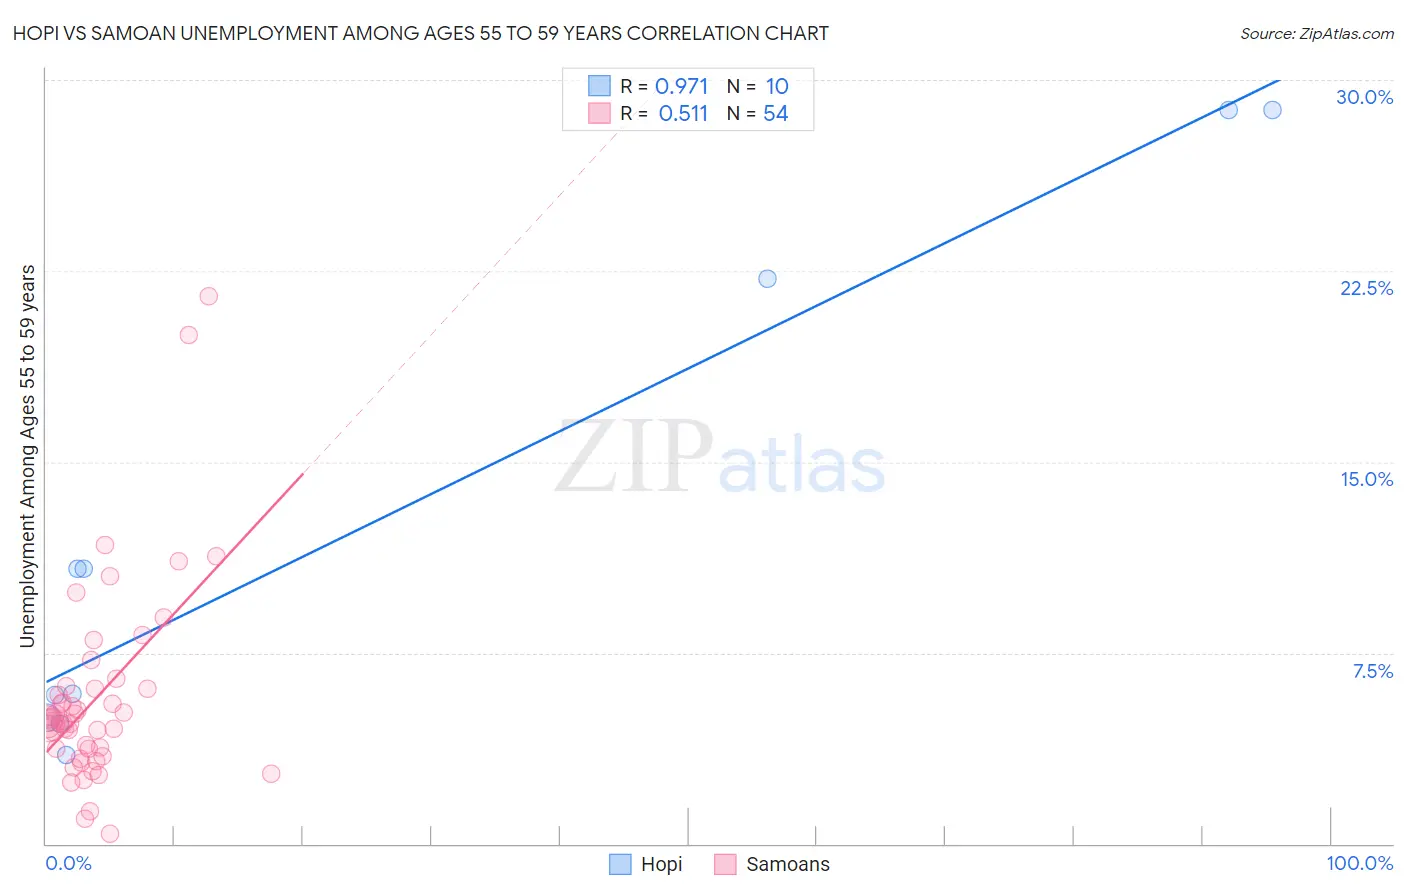
Hopi vs Samoan Unemployment Among Ages 55 to 59 years Correlation Chart
The statistical analysis conducted on geographies consisting of 73,356,460 people shows a perfect positive correlation between the proportion of Hopi and unemployment rate among population between the ages 55 and 59 in the United States with a correlation coefficient (R) of 0.971 and weighted average of 8.1%. Similarly, the statistical analysis conducted on geographies consisting of 215,866,418 people shows a substantial positive correlation between the proportion of Samoans and unemployment rate among population between the ages 55 and 59 in the United States with a correlation coefficient (R) of 0.511 and weighted average of 4.8%, a difference of 68.3%.
Unemployment Among Ages 55 to 59 years Correlation Summary
| Measurement | Hopi | Samoan |
| Minimum | 3.5% | 0.40% |
| Maximum | 28.8% | 21.5% |
| Range | 25.3% | 21.1% |
| Mean | 12.6% | 5.7% |
| Median | 8.3% | 4.8% |
| Interquartile 25% (IQ1) | 4.9% | 3.7% |
| Interquartile 75% (IQ3) | 22.2% | 6.1% |
| Interquartile Range (IQR) | 17.3% | 2.4% |
| Standard Deviation (Sample) | 10.1% | 3.9% |
| Standard Deviation (Population) | 9.6% | 3.8% |
Similar Demographics by Unemployment Among Ages 55 to 59 years
Demographics Similar to Hopi by Unemployment Among Ages 55 to 59 years
In terms of unemployment among ages 55 to 59 years, the demographic groups most similar to Hopi are Yakama (8.9%, a difference of 10.0%), Shoshone (7.4%, a difference of 10.1%), Inupiat (9.0%, a difference of 11.3%), Alaskan Athabascan (7.1%, a difference of 13.8%), and Tohono O'odham (9.3%, a difference of 14.7%).
| Demographics | Rating | Rank | Unemployment Among Ages 55 to 59 years |
| Pima | 0.0 /100 | #333 | Tragic 6.6% |
| Pueblo | 0.0 /100 | #334 | Tragic 6.7% |
| Colville | 0.0 /100 | #335 | Tragic 6.7% |
| Navajo | 0.0 /100 | #336 | Tragic 6.7% |
| Paiute | 0.0 /100 | #337 | Tragic 6.8% |
| Immigrants | Yemen | 0.0 /100 | #338 | Tragic 6.9% |
| Puerto Ricans | 0.0 /100 | #339 | Tragic 7.0% |
| Alaskan Athabascans | 0.0 /100 | #340 | Tragic 7.1% |
| Shoshone | 0.0 /100 | #341 | Tragic 7.4% |
| Hopi | 0.0 /100 | #342 | Tragic 8.1% |
| Yakama | 0.0 /100 | #343 | Tragic 8.9% |
| Inupiat | 0.0 /100 | #344 | Tragic 9.0% |
| Tohono O'odham | 0.0 /100 | #345 | Tragic 9.3% |
| Menominee | 0.0 /100 | #346 | Tragic 10.5% |
| Yup'ik | 0.0 /100 | #347 | Tragic 13.9% |
Demographics Similar to Samoans by Unemployment Among Ages 55 to 59 years
In terms of unemployment among ages 55 to 59 years, the demographic groups most similar to Samoans are Immigrants from Sri Lanka (4.8%, a difference of 0.010%), Australian (4.8%, a difference of 0.060%), Arab (4.8%, a difference of 0.10%), Immigrants from Croatia (4.8%, a difference of 0.12%), and Hungarian (4.8%, a difference of 0.12%).
| Demographics | Rating | Rank | Unemployment Among Ages 55 to 59 years |
| Immigrants | Sudan | 58.4 /100 | #169 | Average 4.8% |
| Uruguayans | 55.6 /100 | #170 | Average 4.8% |
| Japanese | 54.5 /100 | #171 | Average 4.8% |
| Nicaraguans | 54.0 /100 | #172 | Average 4.8% |
| Immigrants | Eastern Europe | 52.2 /100 | #173 | Average 4.8% |
| Immigrants | Croatia | 50.0 /100 | #174 | Average 4.8% |
| Australians | 48.6 /100 | #175 | Average 4.8% |
| Samoans | 47.1 /100 | #176 | Average 4.8% |
| Immigrants | Sri Lanka | 46.8 /100 | #177 | Average 4.8% |
| Arabs | 44.7 /100 | #178 | Average 4.8% |
| Hungarians | 44.3 /100 | #179 | Average 4.8% |
| South Americans | 44.0 /100 | #180 | Average 4.8% |
| Immigrants | Hungary | 40.4 /100 | #181 | Average 4.8% |
| Immigrants | Europe | 40.4 /100 | #182 | Average 4.8% |
| Immigrants | Peru | 38.6 /100 | #183 | Fair 4.8% |