Immigrants from Cabo Verde vs Guamanian/Chamorro Unemployment Among Seniors over 75 years
COMPARE
Immigrants from Cabo Verde
Guamanian/Chamorro
Unemployment Among Seniors over 75 years
Unemployment Among Seniors over 75 years Comparison
Immigrants from Cabo Verde
Guamanians/Chamorros
12.3%
UNEMPLOYMENT AMONG SENIORS OVER 75 YEARS
0.0/ 100
METRIC RATING
338th/ 347
METRIC RANK
9.0%
UNEMPLOYMENT AMONG SENIORS OVER 75 YEARS
7.7/ 100
METRIC RATING
221st/ 347
METRIC RANK
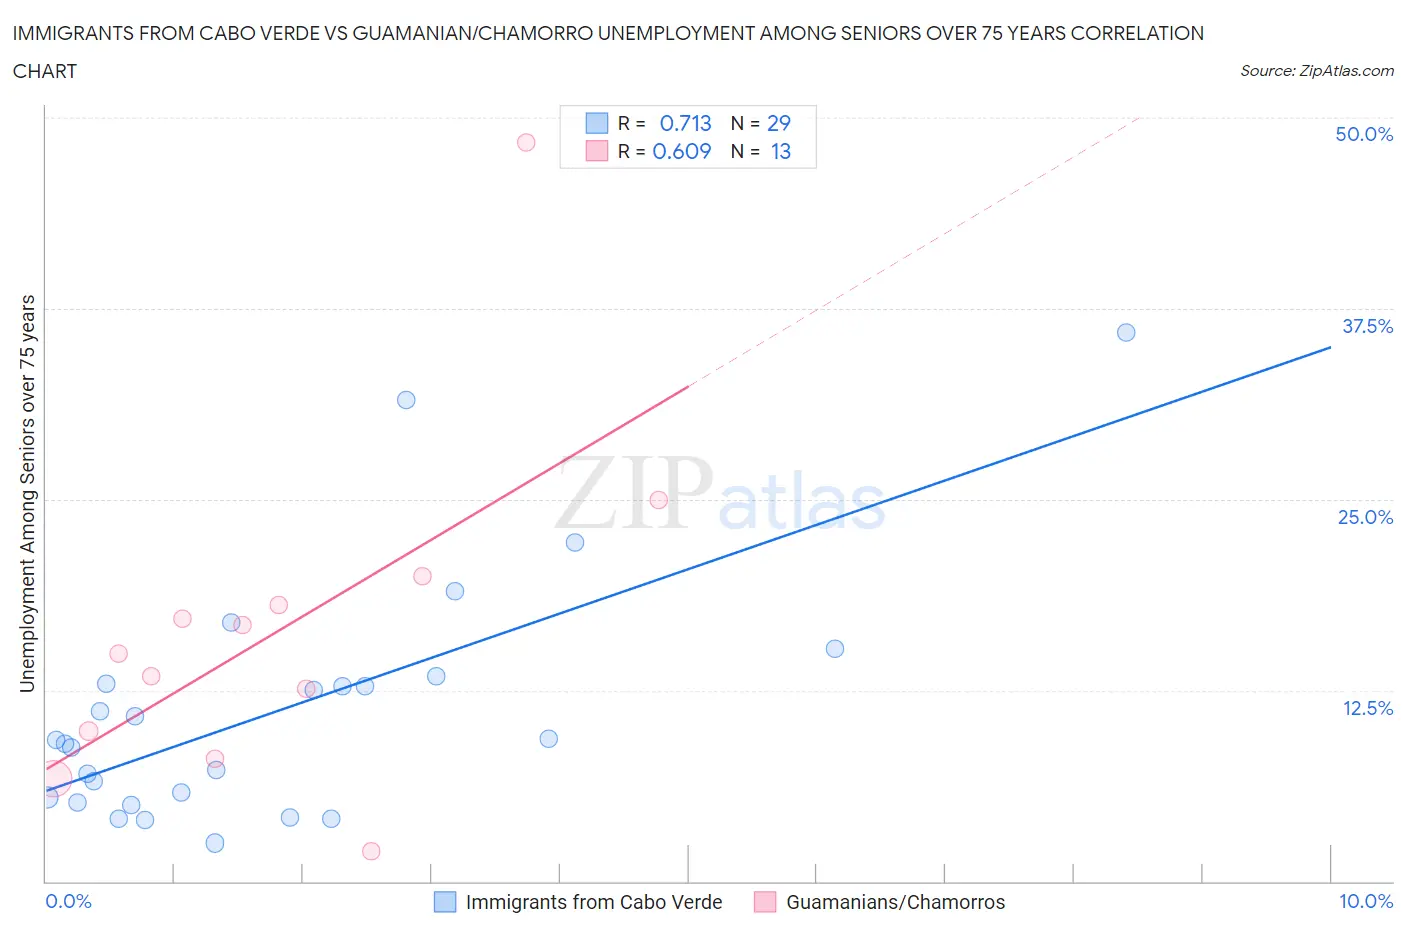
Immigrants from Cabo Verde vs Guamanian/Chamorro Unemployment Among Seniors over 75 years Correlation Chart
The statistical analysis conducted on geographies consisting of 29,962,388 people shows a strong positive correlation between the proportion of Immigrants from Cabo Verde and unemployment rate among seniors over the age of 75 in the United States with a correlation coefficient (R) of 0.713 and weighted average of 12.3%. Similarly, the statistical analysis conducted on geographies consisting of 136,667,243 people shows a significant positive correlation between the proportion of Guamanians/Chamorros and unemployment rate among seniors over the age of 75 in the United States with a correlation coefficient (R) of 0.609 and weighted average of 9.0%, a difference of 36.4%.
Unemployment Among Seniors over 75 years Correlation Summary
| Measurement | Immigrants from Cabo Verde | Guamanian/Chamorro |
| Minimum | 2.5% | 2.0% |
| Maximum | 35.9% | 48.4% |
| Range | 33.4% | 46.4% |
| Mean | 11.2% | 16.4% |
| Median | 9.2% | 14.9% |
| Interquartile 25% (IQ1) | 5.3% | 8.9% |
| Interquartile 75% (IQ3) | 13.2% | 19.0% |
| Interquartile Range (IQR) | 7.8% | 10.1% |
| Standard Deviation (Sample) | 7.9% | 11.4% |
| Standard Deviation (Population) | 7.8% | 10.9% |
Similar Demographics by Unemployment Among Seniors over 75 years
Demographics Similar to Immigrants from Cabo Verde by Unemployment Among Seniors over 75 years
In terms of unemployment among seniors over 75 years, the demographic groups most similar to Immigrants from Cabo Verde are Cajun (12.5%, a difference of 1.3%), Yup'ik (12.8%, a difference of 3.5%), Cape Verdean (11.4%, a difference of 8.1%), Immigrants from North Macedonia (11.3%, a difference of 9.0%), and Lumbee (13.5%, a difference of 9.2%).
| Demographics | Rating | Rank | Unemployment Among Seniors over 75 years |
| Tohono O'odham | 0.0 /100 | #331 | Tragic 10.8% |
| Immigrants | Liberia | 0.0 /100 | #332 | Tragic 10.9% |
| Alaskan Athabascans | 0.0 /100 | #333 | Tragic 11.0% |
| Assyrians/Chaldeans/Syriacs | 0.0 /100 | #334 | Tragic 11.1% |
| French Canadians | 0.0 /100 | #335 | Tragic 11.2% |
| Immigrants | North Macedonia | 0.0 /100 | #336 | Tragic 11.3% |
| Cape Verdeans | 0.0 /100 | #337 | Tragic 11.4% |
| Immigrants | Cabo Verde | 0.0 /100 | #338 | Tragic 12.3% |
| Cajuns | 0.0 /100 | #339 | Tragic 12.5% |
| Yup'ik | 0.0 /100 | #340 | Tragic 12.8% |
| Lumbee | 0.0 /100 | #341 | Tragic 13.5% |
| Hmong | 0.0 /100 | #342 | Tragic 13.7% |
| Alaska Natives | 0.0 /100 | #343 | Tragic 14.7% |
| Immigrants | Yemen | 0.0 /100 | #344 | Tragic 16.5% |
| Yakama | 0.0 /100 | #345 | Tragic 18.4% |
Demographics Similar to Guamanians/Chamorros by Unemployment Among Seniors over 75 years
In terms of unemployment among seniors over 75 years, the demographic groups most similar to Guamanians/Chamorros are Immigrants from Zimbabwe (9.0%, a difference of 0.020%), Peruvian (9.0%, a difference of 0.070%), Afghan (9.0%, a difference of 0.10%), Immigrants from Jordan (9.0%, a difference of 0.14%), and Costa Rican (9.1%, a difference of 0.27%).
| Demographics | Rating | Rank | Unemployment Among Seniors over 75 years |
| Immigrants | Brazil | 13.3 /100 | #214 | Poor 9.0% |
| Immigrants | Western Asia | 12.5 /100 | #215 | Poor 9.0% |
| Immigrants | Oceania | 11.8 /100 | #216 | Poor 9.0% |
| Lebanese | 11.1 /100 | #217 | Poor 9.0% |
| Immigrants | Africa | 9.7 /100 | #218 | Tragic 9.0% |
| Afghans | 8.3 /100 | #219 | Tragic 9.0% |
| Immigrants | Zimbabwe | 7.8 /100 | #220 | Tragic 9.0% |
| Guamanians/Chamorros | 7.7 /100 | #221 | Tragic 9.0% |
| Peruvians | 7.3 /100 | #222 | Tragic 9.0% |
| Immigrants | Jordan | 6.9 /100 | #223 | Tragic 9.0% |
| Costa Ricans | 6.3 /100 | #224 | Tragic 9.1% |
| Navajo | 6.1 /100 | #225 | Tragic 9.1% |
| Immigrants | Bangladesh | 5.9 /100 | #226 | Tragic 9.1% |
| Samoans | 5.7 /100 | #227 | Tragic 9.1% |
| Kenyans | 5.4 /100 | #228 | Tragic 9.1% |