Hispanic or Latino vs Serbian Unemployment Among Ages 16 to 19 years
COMPARE
Hispanic or Latino
Serbian
Unemployment Among Ages 16 to 19 years
Unemployment Among Ages 16 to 19 years Comparison
Hispanics or Latinos
Serbians
19.2%
UNEMPLOYMENT AMONG AGES 16 TO 19 YEARS
0.0/ 100
METRIC RATING
272nd/ 347
METRIC RANK
16.7%
UNEMPLOYMENT AMONG AGES 16 TO 19 YEARS
98.7/ 100
METRIC RATING
69th/ 347
METRIC RANK
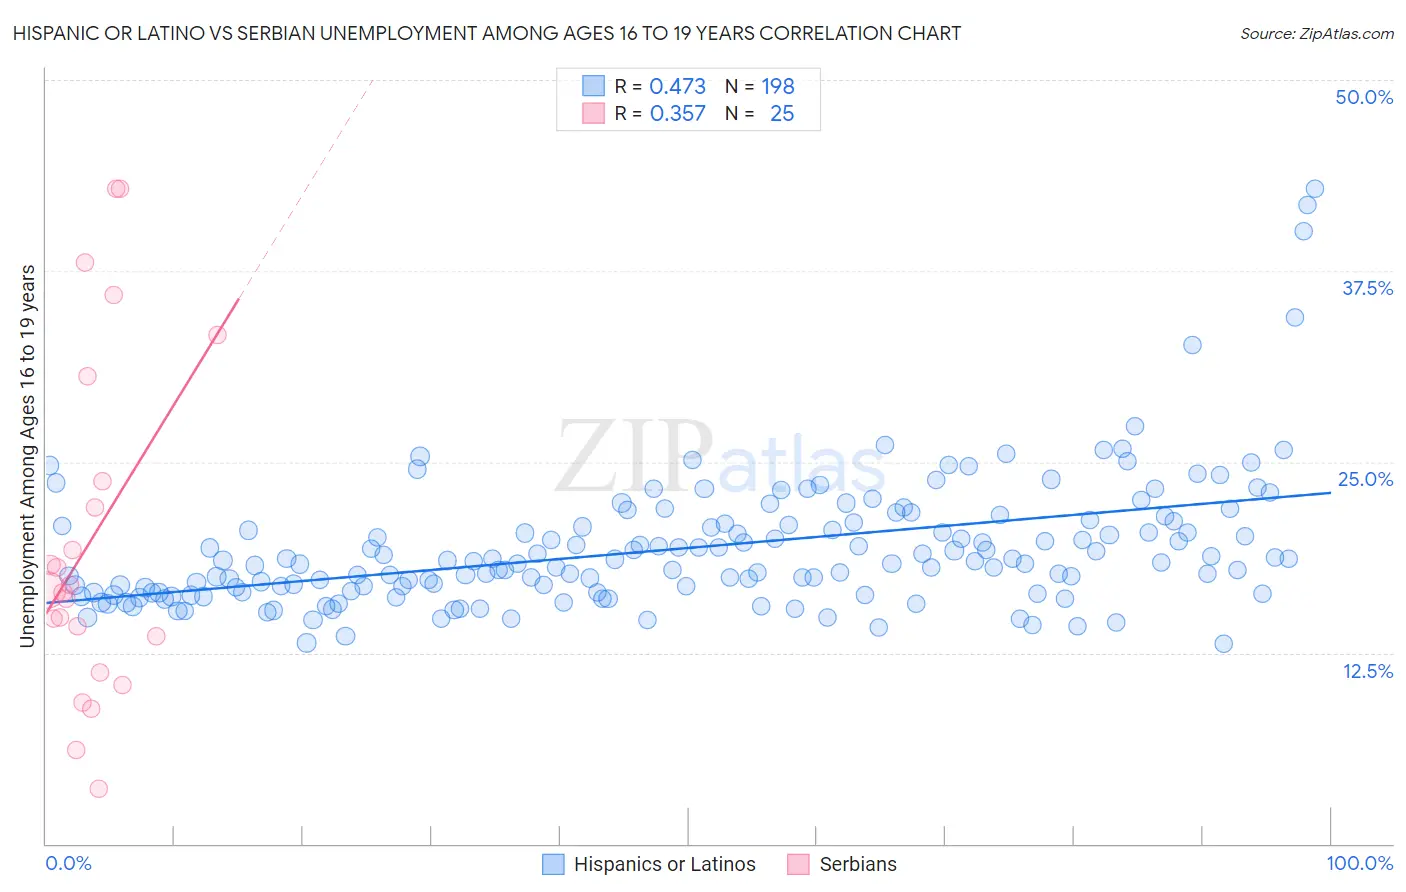
Hispanic or Latino vs Serbian Unemployment Among Ages 16 to 19 years Correlation Chart
The statistical analysis conducted on geographies consisting of 510,884,853 people shows a moderate positive correlation between the proportion of Hispanics or Latinos and unemployment rate among population between the ages 16 and 19 in the United States with a correlation coefficient (R) of 0.473 and weighted average of 19.2%. Similarly, the statistical analysis conducted on geographies consisting of 256,290,182 people shows a mild positive correlation between the proportion of Serbians and unemployment rate among population between the ages 16 and 19 in the United States with a correlation coefficient (R) of 0.357 and weighted average of 16.7%, a difference of 15.4%.
Unemployment Among Ages 16 to 19 years Correlation Summary
| Measurement | Hispanic or Latino | Serbian |
| Minimum | 13.1% | 3.6% |
| Maximum | 42.9% | 42.9% |
| Range | 29.7% | 39.3% |
| Mean | 19.3% | 19.9% |
| Median | 18.4% | 16.6% |
| Interquartile 25% (IQ1) | 16.4% | 12.4% |
| Interquartile 75% (IQ3) | 20.9% | 27.2% |
| Interquartile Range (IQR) | 4.4% | 14.8% |
| Standard Deviation (Sample) | 4.4% | 11.2% |
| Standard Deviation (Population) | 4.4% | 10.9% |
Similar Demographics by Unemployment Among Ages 16 to 19 years
Demographics Similar to Hispanics or Latinos by Unemployment Among Ages 16 to 19 years
In terms of unemployment among ages 16 to 19 years, the demographic groups most similar to Hispanics or Latinos are Blackfeet (19.2%, a difference of 0.12%), Immigrants from Panama (19.3%, a difference of 0.13%), Shoshone (19.3%, a difference of 0.28%), Honduran (19.2%, a difference of 0.50%), and Paraguayan (19.4%, a difference of 0.60%).
| Demographics | Rating | Rank | Unemployment Among Ages 16 to 19 years |
| Choctaw | 0.1 /100 | #265 | Tragic 19.0% |
| Immigrants | Honduras | 0.1 /100 | #266 | Tragic 19.0% |
| Israelis | 0.1 /100 | #267 | Tragic 19.0% |
| Immigrants | El Salvador | 0.1 /100 | #268 | Tragic 19.1% |
| Lumbee | 0.1 /100 | #269 | Tragic 19.1% |
| Hondurans | 0.1 /100 | #270 | Tragic 19.2% |
| Blackfeet | 0.0 /100 | #271 | Tragic 19.2% |
| Hispanics or Latinos | 0.0 /100 | #272 | Tragic 19.2% |
| Immigrants | Panama | 0.0 /100 | #273 | Tragic 19.3% |
| Shoshone | 0.0 /100 | #274 | Tragic 19.3% |
| Paraguayans | 0.0 /100 | #275 | Tragic 19.4% |
| Immigrants | Latin America | 0.0 /100 | #276 | Tragic 19.4% |
| Immigrants | Western Africa | 0.0 /100 | #277 | Tragic 19.4% |
| Africans | 0.0 /100 | #278 | Tragic 19.5% |
| Ute | 0.0 /100 | #279 | Tragic 19.6% |
Demographics Similar to Serbians by Unemployment Among Ages 16 to 19 years
In terms of unemployment among ages 16 to 19 years, the demographic groups most similar to Serbians are Austrian (16.7%, a difference of 0.060%), Chickasaw (16.7%, a difference of 0.070%), Slavic (16.7%, a difference of 0.080%), Latvian (16.7%, a difference of 0.13%), and Immigrants from Canada (16.7%, a difference of 0.16%).
| Demographics | Rating | Rank | Unemployment Among Ages 16 to 19 years |
| Macedonians | 99.2 /100 | #62 | Exceptional 16.6% |
| Scotch-Irish | 99.1 /100 | #63 | Exceptional 16.6% |
| Northern Europeans | 99.0 /100 | #64 | Exceptional 16.6% |
| Immigrants | Japan | 98.9 /100 | #65 | Exceptional 16.6% |
| Okinawans | 98.9 /100 | #66 | Exceptional 16.6% |
| Slavs | 98.7 /100 | #67 | Exceptional 16.7% |
| Chickasaw | 98.7 /100 | #68 | Exceptional 16.7% |
| Serbians | 98.7 /100 | #69 | Exceptional 16.7% |
| Austrians | 98.6 /100 | #70 | Exceptional 16.7% |
| Latvians | 98.5 /100 | #71 | Exceptional 16.7% |
| Immigrants | Canada | 98.5 /100 | #72 | Exceptional 16.7% |
| Lithuanians | 98.2 /100 | #73 | Exceptional 16.7% |
| Immigrants | Eastern Africa | 98.1 /100 | #74 | Exceptional 16.8% |
| New Zealanders | 98.0 /100 | #75 | Exceptional 16.8% |
| Immigrants | North America | 97.9 /100 | #76 | Exceptional 16.8% |