Immigrants from Japan vs Shoshone Unemployment Among Ages 25 to 29 years
COMPARE
Immigrants from Japan
Shoshone
Unemployment Among Ages 25 to 29 years
Unemployment Among Ages 25 to 29 years Comparison
Immigrants from Japan
Shoshone
6.0%
UNEMPLOYMENT AMONG AGES 25 TO 29 YEARS
99.9/ 100
METRIC RATING
22nd/ 347
METRIC RANK
9.2%
UNEMPLOYMENT AMONG AGES 25 TO 29 YEARS
0.0/ 100
METRIC RATING
326th/ 347
METRIC RANK
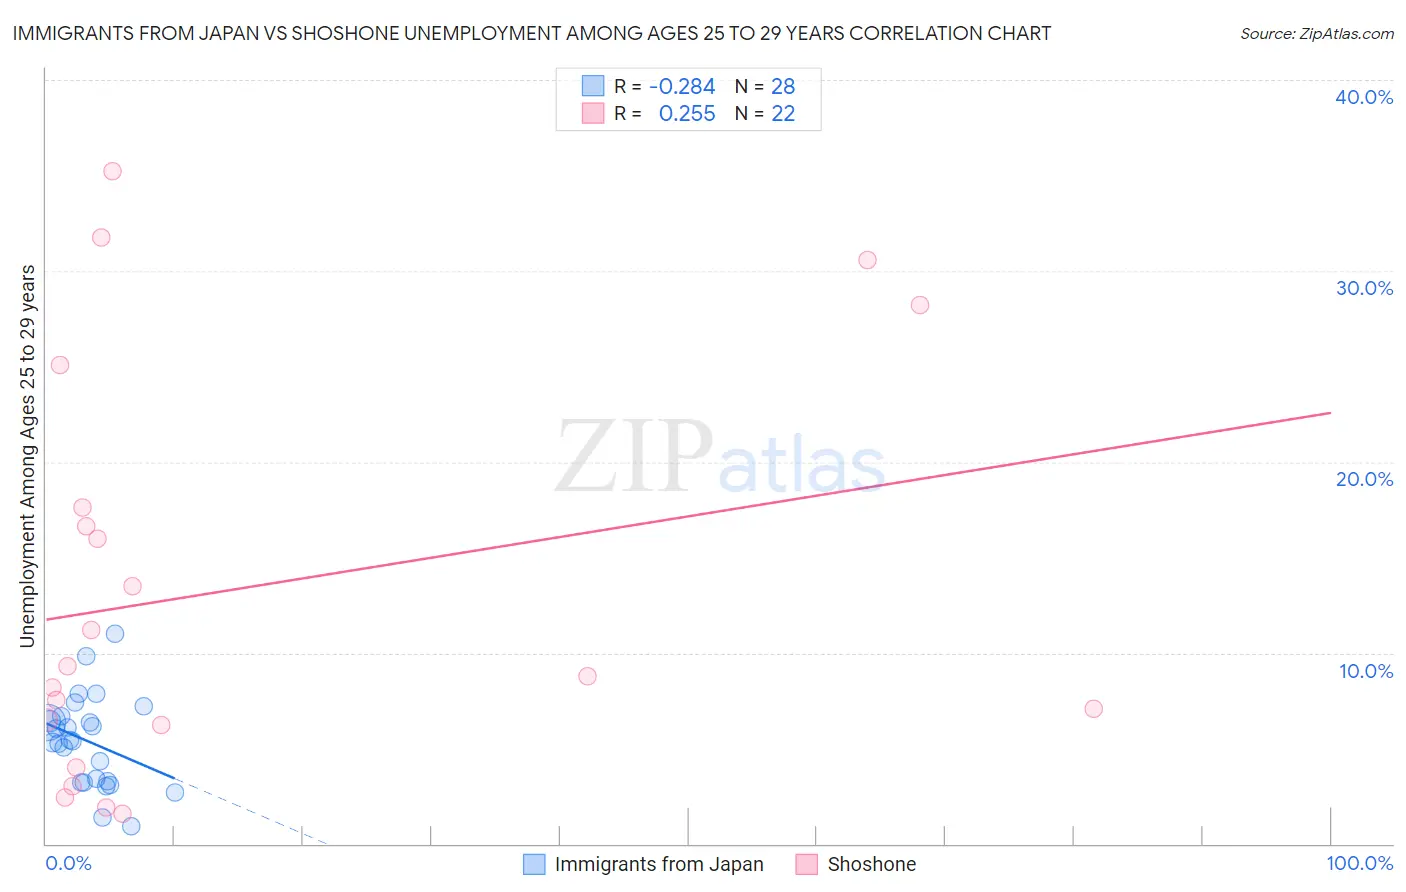
Immigrants from Japan vs Shoshone Unemployment Among Ages 25 to 29 years Correlation Chart
The statistical analysis conducted on geographies consisting of 327,117,798 people shows a weak negative correlation between the proportion of Immigrants from Japan and unemployment rate among population between the ages 25 and 29 in the United States with a correlation coefficient (R) of -0.284 and weighted average of 6.0%. Similarly, the statistical analysis conducted on geographies consisting of 65,507,418 people shows a weak positive correlation between the proportion of Shoshone and unemployment rate among population between the ages 25 and 29 in the United States with a correlation coefficient (R) of 0.255 and weighted average of 9.2%, a difference of 54.2%.
Unemployment Among Ages 25 to 29 years Correlation Summary
| Measurement | Immigrants from Japan | Shoshone |
| Minimum | 0.90% | 1.6% |
| Maximum | 11.0% | 35.2% |
| Range | 10.1% | 33.6% |
| Mean | 5.4% | 13.3% |
| Median | 5.4% | 9.1% |
| Interquartile 25% (IQ1) | 3.3% | 6.2% |
| Interquartile 75% (IQ3) | 6.5% | 17.6% |
| Interquartile Range (IQR) | 3.3% | 11.4% |
| Standard Deviation (Sample) | 2.4% | 10.5% |
| Standard Deviation (Population) | 2.3% | 10.3% |
Similar Demographics by Unemployment Among Ages 25 to 29 years
Demographics Similar to Immigrants from Japan by Unemployment Among Ages 25 to 29 years
In terms of unemployment among ages 25 to 29 years, the demographic groups most similar to Immigrants from Japan are Immigrants from Venezuela (6.0%, a difference of 0.060%), Norwegian (6.0%, a difference of 0.11%), Immigrants from Ethiopia (6.0%, a difference of 0.27%), Immigrants from Eritrea (5.9%, a difference of 0.61%), and New Zealander (6.0%, a difference of 0.75%).
| Demographics | Rating | Rank | Unemployment Among Ages 25 to 29 years |
| Cubans | 99.9 /100 | #15 | Exceptional 5.9% |
| Immigrants | Bulgaria | 99.9 /100 | #16 | Exceptional 5.9% |
| Bolivians | 99.9 /100 | #17 | Exceptional 5.9% |
| Immigrants | Singapore | 99.9 /100 | #18 | Exceptional 5.9% |
| Thais | 99.9 /100 | #19 | Exceptional 5.9% |
| Immigrants | Eritrea | 99.9 /100 | #20 | Exceptional 5.9% |
| Immigrants | Ethiopia | 99.9 /100 | #21 | Exceptional 6.0% |
| Immigrants | Japan | 99.9 /100 | #22 | Exceptional 6.0% |
| Immigrants | Venezuela | 99.8 /100 | #23 | Exceptional 6.0% |
| Norwegians | 99.8 /100 | #24 | Exceptional 6.0% |
| New Zealanders | 99.8 /100 | #25 | Exceptional 6.0% |
| Immigrants | Eastern Africa | 99.8 /100 | #26 | Exceptional 6.0% |
| Immigrants | Zaire | 99.7 /100 | #27 | Exceptional 6.0% |
| Danes | 99.7 /100 | #28 | Exceptional 6.0% |
| Immigrants | South Central Asia | 99.7 /100 | #29 | Exceptional 6.1% |
Demographics Similar to Shoshone by Unemployment Among Ages 25 to 29 years
In terms of unemployment among ages 25 to 29 years, the demographic groups most similar to Shoshone are Colville (9.2%, a difference of 0.16%), Apache (9.5%, a difference of 2.8%), Aleut (9.7%, a difference of 5.0%), Yakama (8.8%, a difference of 5.3%), and Houma (8.7%, a difference of 5.8%).
| Demographics | Rating | Rank | Unemployment Among Ages 25 to 29 years |
| Immigrants | Armenia | 0.0 /100 | #319 | Tragic 8.5% |
| Blacks/African Americans | 0.0 /100 | #320 | Tragic 8.6% |
| Immigrants | Dominican Republic | 0.0 /100 | #321 | Tragic 8.6% |
| Tlingit-Haida | 0.0 /100 | #322 | Tragic 8.7% |
| Dominicans | 0.0 /100 | #323 | Tragic 8.7% |
| Houma | 0.0 /100 | #324 | Tragic 8.7% |
| Yakama | 0.0 /100 | #325 | Tragic 8.8% |
| Shoshone | 0.0 /100 | #326 | Tragic 9.2% |
| Colville | 0.0 /100 | #327 | Tragic 9.2% |
| Apache | 0.0 /100 | #328 | Tragic 9.5% |
| Aleuts | 0.0 /100 | #329 | Tragic 9.7% |
| Natives/Alaskans | 0.0 /100 | #330 | Tragic 9.8% |
| Alaska Natives | 0.0 /100 | #331 | Tragic 10.2% |
| Pueblo | 0.0 /100 | #332 | Tragic 10.4% |
| Alaskan Athabascans | 0.0 /100 | #333 | Tragic 10.8% |