Haitian vs Immigrants from South Central Asia Unemployment Among Ages 20 to 24 years
COMPARE
Haitian
Immigrants from South Central Asia
Unemployment Among Ages 20 to 24 years
Unemployment Among Ages 20 to 24 years Comparison
Haitians
Immigrants from South Central Asia
12.2%
UNEMPLOYMENT AMONG AGES 20 TO 24 YEARS
0.0/ 100
METRIC RATING
303rd/ 347
METRIC RANK
10.1%
UNEMPLOYMENT AMONG AGES 20 TO 24 YEARS
84.6/ 100
METRIC RATING
129th/ 347
METRIC RANK
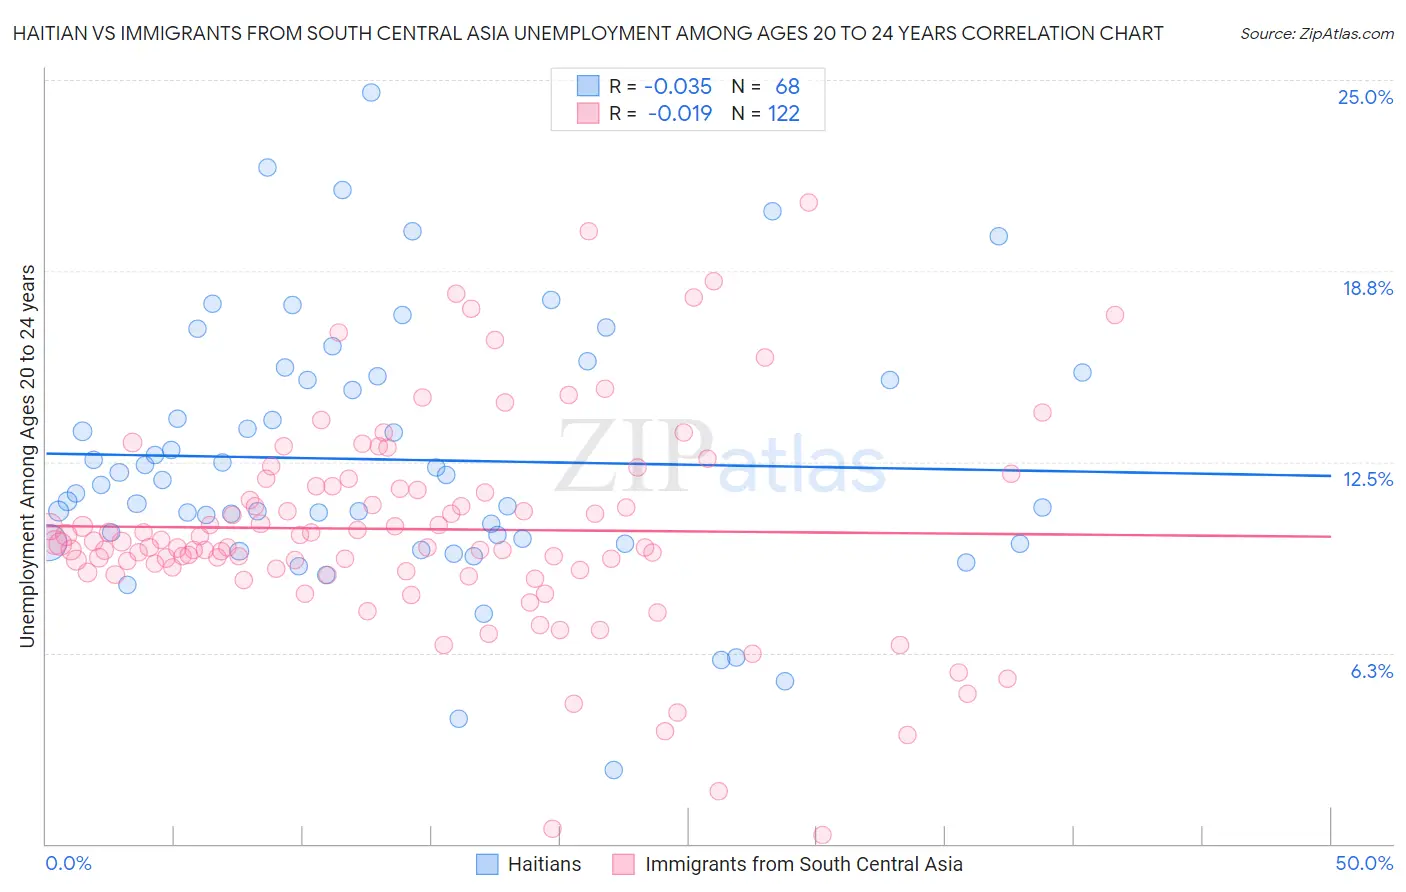
Haitian vs Immigrants from South Central Asia Unemployment Among Ages 20 to 24 years Correlation Chart
The statistical analysis conducted on geographies consisting of 282,021,864 people shows no correlation between the proportion of Haitians and unemployment rate among population between the ages 20 and 24 in the United States with a correlation coefficient (R) of -0.035 and weighted average of 12.2%. Similarly, the statistical analysis conducted on geographies consisting of 454,671,108 people shows no correlation between the proportion of Immigrants from South Central Asia and unemployment rate among population between the ages 20 and 24 in the United States with a correlation coefficient (R) of -0.019 and weighted average of 10.1%, a difference of 20.4%.
Unemployment Among Ages 20 to 24 years Correlation Summary
| Measurement | Haitian | Immigrants from South Central Asia |
| Minimum | 2.4% | 0.30% |
| Maximum | 24.6% | 21.0% |
| Range | 22.2% | 20.7% |
| Mean | 12.6% | 10.3% |
| Median | 11.8% | 9.8% |
| Interquartile 25% (IQ1) | 9.9% | 9.0% |
| Interquartile 75% (IQ3) | 15.3% | 11.7% |
| Interquartile Range (IQR) | 5.3% | 2.7% |
| Standard Deviation (Sample) | 4.2% | 3.5% |
| Standard Deviation (Population) | 4.2% | 3.5% |
Similar Demographics by Unemployment Among Ages 20 to 24 years
Demographics Similar to Haitians by Unemployment Among Ages 20 to 24 years
In terms of unemployment among ages 20 to 24 years, the demographic groups most similar to Haitians are Immigrants from Cabo Verde (12.2%, a difference of 0.020%), Immigrants from West Indies (12.3%, a difference of 0.59%), Chippewa (12.3%, a difference of 0.64%), Immigrants from Sierra Leone (12.1%, a difference of 0.87%), and Spanish American Indian (12.1%, a difference of 1.4%).
| Demographics | Rating | Rank | Unemployment Among Ages 20 to 24 years |
| Cajuns | 0.0 /100 | #296 | Tragic 12.0% |
| Blackfeet | 0.0 /100 | #297 | Tragic 12.0% |
| Lumbee | 0.0 /100 | #298 | Tragic 12.0% |
| Apache | 0.0 /100 | #299 | Tragic 12.0% |
| Spanish American Indians | 0.0 /100 | #300 | Tragic 12.1% |
| Immigrants | Sierra Leone | 0.0 /100 | #301 | Tragic 12.1% |
| Immigrants | Cabo Verde | 0.0 /100 | #302 | Tragic 12.2% |
| Haitians | 0.0 /100 | #303 | Tragic 12.2% |
| Immigrants | West Indies | 0.0 /100 | #304 | Tragic 12.3% |
| Chippewa | 0.0 /100 | #305 | Tragic 12.3% |
| Immigrants | Haiti | 0.0 /100 | #306 | Tragic 12.4% |
| Bermudans | 0.0 /100 | #307 | Tragic 12.5% |
| Tohono O'odham | 0.0 /100 | #308 | Tragic 12.5% |
| Immigrants | Bangladesh | 0.0 /100 | #309 | Tragic 12.6% |
| Jamaicans | 0.0 /100 | #310 | Tragic 12.6% |
Demographics Similar to Immigrants from South Central Asia by Unemployment Among Ages 20 to 24 years
In terms of unemployment among ages 20 to 24 years, the demographic groups most similar to Immigrants from South Central Asia are Immigrants from Brazil (10.1%, a difference of 0.020%), Immigrants from Lithuania (10.1%, a difference of 0.030%), Seminole (10.1%, a difference of 0.030%), Immigrants from South Eastern Asia (10.1%, a difference of 0.040%), and Immigrants from Norway (10.1%, a difference of 0.050%).
| Demographics | Rating | Rank | Unemployment Among Ages 20 to 24 years |
| Whites/Caucasians | 87.4 /100 | #122 | Excellent 10.1% |
| Immigrants | Iraq | 87.1 /100 | #123 | Excellent 10.1% |
| Immigrants | Japan | 86.5 /100 | #124 | Excellent 10.1% |
| Spanish | 86.1 /100 | #125 | Excellent 10.1% |
| Jordanians | 86.1 /100 | #126 | Excellent 10.1% |
| Immigrants | Norway | 85.3 /100 | #127 | Excellent 10.1% |
| Immigrants | Brazil | 84.9 /100 | #128 | Excellent 10.1% |
| Immigrants | South Central Asia | 84.6 /100 | #129 | Excellent 10.1% |
| Immigrants | Lithuania | 84.2 /100 | #130 | Excellent 10.1% |
| Seminole | 84.2 /100 | #131 | Excellent 10.1% |
| Immigrants | South Eastern Asia | 84.0 /100 | #132 | Excellent 10.1% |
| Austrians | 83.9 /100 | #133 | Excellent 10.2% |
| Romanians | 83.8 /100 | #134 | Excellent 10.2% |
| Comanche | 83.4 /100 | #135 | Excellent 10.2% |
| Immigrants | Northern Africa | 82.5 /100 | #136 | Excellent 10.2% |