Haitian vs Immigrants from Kazakhstan Unemployment Among Ages 45 to 54 years
COMPARE
Haitian
Immigrants from Kazakhstan
Unemployment Among Ages 45 to 54 years
Unemployment Among Ages 45 to 54 years Comparison
Haitians
Immigrants from Kazakhstan
5.2%
UNEMPLOYMENT AMONG AGES 45 TO 54 YEARS
0.0/ 100
METRIC RATING
287th/ 347
METRIC RANK
4.4%
UNEMPLOYMENT AMONG AGES 45 TO 54 YEARS
89.5/ 100
METRIC RATING
122nd/ 347
METRIC RANK
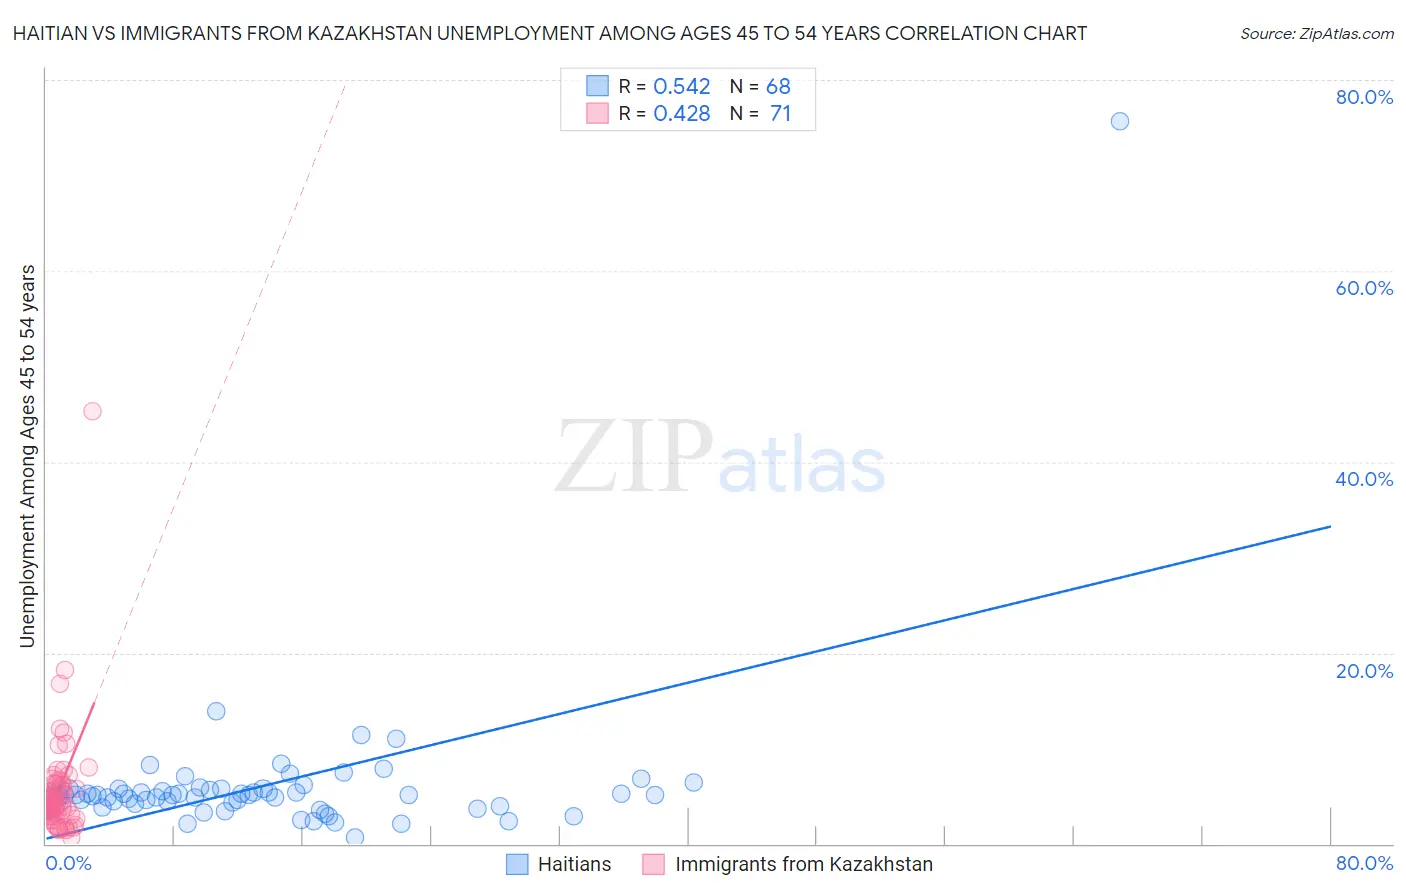
Haitian vs Immigrants from Kazakhstan Unemployment Among Ages 45 to 54 years Correlation Chart
The statistical analysis conducted on geographies consisting of 282,569,188 people shows a substantial positive correlation between the proportion of Haitians and unemployment rate among population between the ages 45 and 54 in the United States with a correlation coefficient (R) of 0.542 and weighted average of 5.2%. Similarly, the statistical analysis conducted on geographies consisting of 123,647,283 people shows a moderate positive correlation between the proportion of Immigrants from Kazakhstan and unemployment rate among population between the ages 45 and 54 in the United States with a correlation coefficient (R) of 0.428 and weighted average of 4.4%, a difference of 17.3%.
Unemployment Among Ages 45 to 54 years Correlation Summary
| Measurement | Haitian | Immigrants from Kazakhstan |
| Minimum | 0.70% | 0.70% |
| Maximum | 75.7% | 45.3% |
| Range | 75.0% | 44.6% |
| Mean | 6.2% | 5.5% |
| Median | 5.1% | 4.2% |
| Interquartile 25% (IQ1) | 4.3% | 3.2% |
| Interquartile 75% (IQ3) | 5.7% | 6.2% |
| Interquartile Range (IQR) | 1.4% | 3.0% |
| Standard Deviation (Sample) | 8.8% | 5.8% |
| Standard Deviation (Population) | 8.7% | 5.7% |
Similar Demographics by Unemployment Among Ages 45 to 54 years
Demographics Similar to Haitians by Unemployment Among Ages 45 to 54 years
In terms of unemployment among ages 45 to 54 years, the demographic groups most similar to Haitians are Immigrants from Caribbean (5.2%, a difference of 0.080%), Immigrants from Haiti (5.2%, a difference of 0.47%), Immigrants from Portugal (5.2%, a difference of 0.64%), Armenian (5.2%, a difference of 0.64%), and Senegalese (5.1%, a difference of 0.83%).
| Demographics | Rating | Rank | Unemployment Among Ages 45 to 54 years |
| Blackfeet | 0.0 /100 | #280 | Tragic 5.1% |
| Spanish American Indians | 0.0 /100 | #281 | Tragic 5.1% |
| Africans | 0.0 /100 | #282 | Tragic 5.1% |
| Hispanics or Latinos | 0.0 /100 | #283 | Tragic 5.1% |
| Kiowa | 0.0 /100 | #284 | Tragic 5.1% |
| Iroquois | 0.0 /100 | #285 | Tragic 5.1% |
| Senegalese | 0.0 /100 | #286 | Tragic 5.1% |
| Haitians | 0.0 /100 | #287 | Tragic 5.2% |
| Immigrants | Caribbean | 0.0 /100 | #288 | Tragic 5.2% |
| Immigrants | Haiti | 0.0 /100 | #289 | Tragic 5.2% |
| Immigrants | Portugal | 0.0 /100 | #290 | Tragic 5.2% |
| Armenians | 0.0 /100 | #291 | Tragic 5.2% |
| Trinidadians and Tobagonians | 0.0 /100 | #292 | Tragic 5.2% |
| Immigrants | Senegal | 0.0 /100 | #293 | Tragic 5.2% |
| Belizeans | 0.0 /100 | #294 | Tragic 5.2% |
Demographics Similar to Immigrants from Kazakhstan by Unemployment Among Ages 45 to 54 years
In terms of unemployment among ages 45 to 54 years, the demographic groups most similar to Immigrants from Kazakhstan are American (4.4%, a difference of 0.010%), Immigrants from Oceania (4.4%, a difference of 0.010%), Native Hawaiian (4.4%, a difference of 0.060%), Immigrants from Romania (4.4%, a difference of 0.070%), and Immigrants from Asia (4.4%, a difference of 0.090%).
| Demographics | Rating | Rank | Unemployment Among Ages 45 to 54 years |
| Pakistanis | 90.7 /100 | #115 | Exceptional 4.4% |
| Immigrants | North Macedonia | 90.6 /100 | #116 | Exceptional 4.4% |
| South Africans | 90.4 /100 | #117 | Exceptional 4.4% |
| Immigrants | Romania | 90.0 /100 | #118 | Exceptional 4.4% |
| Native Hawaiians | 90.0 /100 | #119 | Excellent 4.4% |
| Americans | 89.6 /100 | #120 | Excellent 4.4% |
| Immigrants | Oceania | 89.5 /100 | #121 | Excellent 4.4% |
| Immigrants | Kazakhstan | 89.5 /100 | #122 | Excellent 4.4% |
| Immigrants | Asia | 88.8 /100 | #123 | Excellent 4.4% |
| Spanish | 88.8 /100 | #124 | Excellent 4.4% |
| Immigrants | Vietnam | 88.6 /100 | #125 | Excellent 4.4% |
| Immigrants | Czechoslovakia | 87.8 /100 | #126 | Excellent 4.4% |
| Nicaraguans | 87.6 /100 | #127 | Excellent 4.4% |
| Immigrants | Northern Europe | 86.9 /100 | #128 | Excellent 4.4% |
| Laotians | 86.3 /100 | #129 | Excellent 4.4% |