South African vs Latvian Unemployment Among Ages 20 to 24 years
COMPARE
South African
Latvian
Unemployment Among Ages 20 to 24 years
Unemployment Among Ages 20 to 24 years Comparison
South Africans
Latvians
10.1%
UNEMPLOYMENT AMONG AGES 20 TO 24 YEARS
87.8/ 100
METRIC RATING
121st/ 347
METRIC RANK
9.9%
UNEMPLOYMENT AMONG AGES 20 TO 24 YEARS
97.9/ 100
METRIC RATING
84th/ 347
METRIC RANK
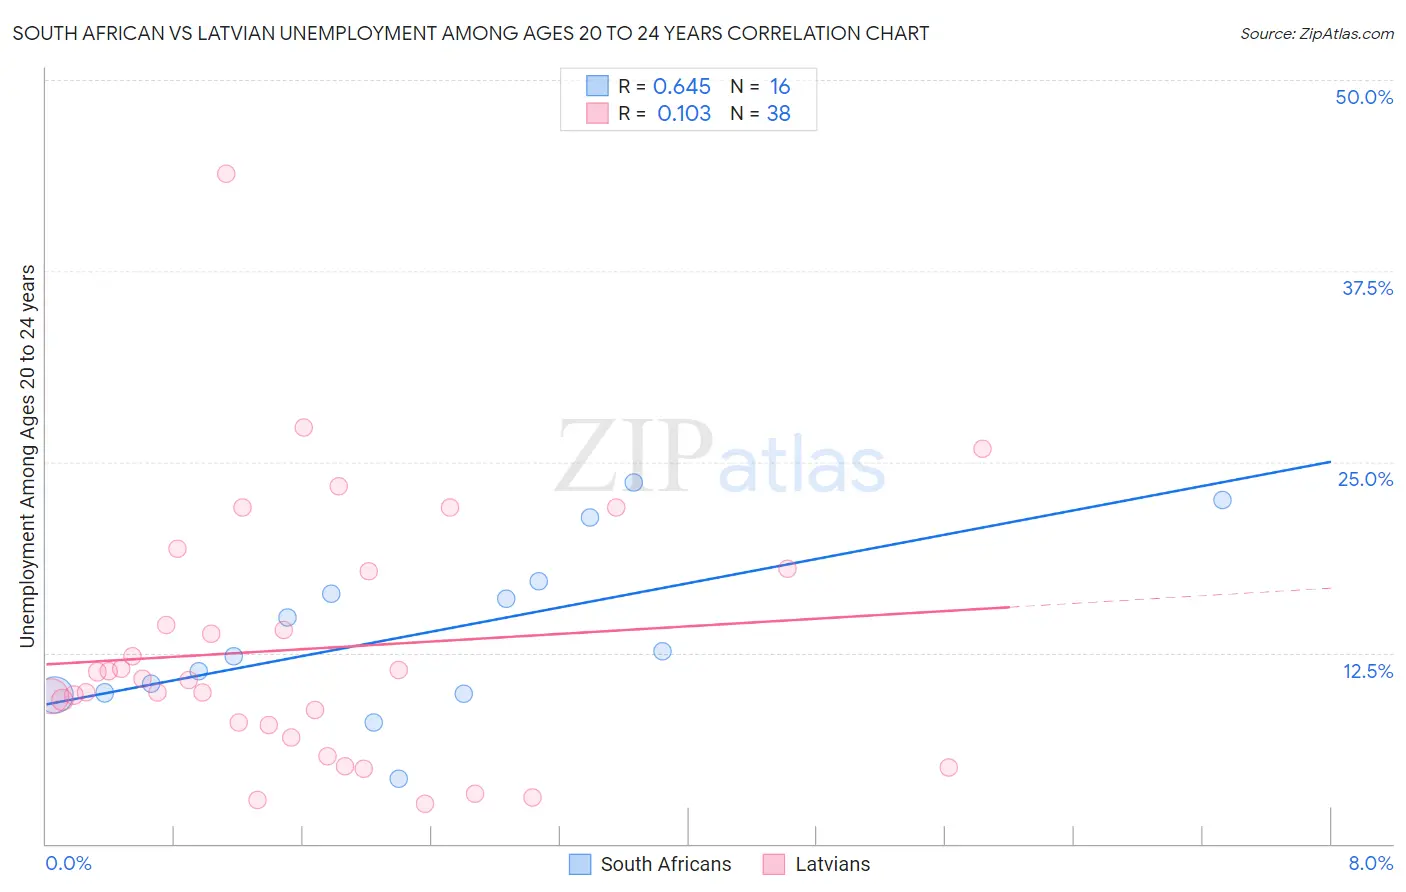
South African vs Latvian Unemployment Among Ages 20 to 24 years Correlation Chart
The statistical analysis conducted on geographies consisting of 179,868,071 people shows a significant positive correlation between the proportion of South Africans and unemployment rate among population between the ages 20 and 24 in the United States with a correlation coefficient (R) of 0.645 and weighted average of 10.1%. Similarly, the statistical analysis conducted on geographies consisting of 215,911,655 people shows a poor positive correlation between the proportion of Latvians and unemployment rate among population between the ages 20 and 24 in the United States with a correlation coefficient (R) of 0.103 and weighted average of 9.9%, a difference of 1.8%.
Unemployment Among Ages 20 to 24 years Correlation Summary
| Measurement | South African | Latvian |
| Minimum | 4.3% | 2.7% |
| Maximum | 23.7% | 43.9% |
| Range | 19.4% | 41.2% |
| Mean | 13.8% | 12.8% |
| Median | 12.4% | 10.8% |
| Interquartile 25% (IQ1) | 9.8% | 7.8% |
| Interquartile 75% (IQ3) | 16.8% | 17.8% |
| Interquartile Range (IQR) | 6.9% | 10.0% |
| Standard Deviation (Sample) | 5.5% | 8.4% |
| Standard Deviation (Population) | 5.3% | 8.3% |
Similar Demographics by Unemployment Among Ages 20 to 24 years
Demographics Similar to South Africans by Unemployment Among Ages 20 to 24 years
In terms of unemployment among ages 20 to 24 years, the demographic groups most similar to South Africans are Immigrants from Canada (10.1%, a difference of 0.030%), French (10.1%, a difference of 0.040%), White/Caucasian (10.1%, a difference of 0.040%), Immigrants from Iraq (10.1%, a difference of 0.060%), and Paraguayan (10.1%, a difference of 0.070%).
| Demographics | Rating | Rank | Unemployment Among Ages 20 to 24 years |
| Ottawa | 90.8 /100 | #114 | Exceptional 10.1% |
| Immigrants | Morocco | 90.5 /100 | #115 | Exceptional 10.1% |
| Basques | 89.8 /100 | #116 | Excellent 10.1% |
| Immigrants | Uruguay | 89.6 /100 | #117 | Excellent 10.1% |
| Paraguayans | 88.6 /100 | #118 | Excellent 10.1% |
| French | 88.2 /100 | #119 | Excellent 10.1% |
| Immigrants | Canada | 88.2 /100 | #120 | Excellent 10.1% |
| South Africans | 87.8 /100 | #121 | Excellent 10.1% |
| Whites/Caucasians | 87.4 /100 | #122 | Excellent 10.1% |
| Immigrants | Iraq | 87.1 /100 | #123 | Excellent 10.1% |
| Immigrants | Japan | 86.5 /100 | #124 | Excellent 10.1% |
| Spanish | 86.1 /100 | #125 | Excellent 10.1% |
| Jordanians | 86.1 /100 | #126 | Excellent 10.1% |
| Immigrants | Norway | 85.3 /100 | #127 | Excellent 10.1% |
| Immigrants | Brazil | 84.9 /100 | #128 | Excellent 10.1% |
Demographics Similar to Latvians by Unemployment Among Ages 20 to 24 years
In terms of unemployment among ages 20 to 24 years, the demographic groups most similar to Latvians are Immigrants from Bulgaria (9.9%, a difference of 0.010%), Yaqui (9.9%, a difference of 0.030%), Sri Lankan (9.9%, a difference of 0.030%), New Zealander (9.9%, a difference of 0.050%), and Immigrants from Netherlands (9.9%, a difference of 0.14%).
| Demographics | Rating | Rank | Unemployment Among Ages 20 to 24 years |
| Chickasaw | 98.4 /100 | #77 | Exceptional 9.9% |
| Assyrians/Chaldeans/Syriacs | 98.3 /100 | #78 | Exceptional 9.9% |
| Icelanders | 98.3 /100 | #79 | Exceptional 9.9% |
| Immigrants | Netherlands | 98.2 /100 | #80 | Exceptional 9.9% |
| Yaqui | 98.0 /100 | #81 | Exceptional 9.9% |
| Sri Lankans | 98.0 /100 | #82 | Exceptional 9.9% |
| Immigrants | Bulgaria | 98.0 /100 | #83 | Exceptional 9.9% |
| Latvians | 97.9 /100 | #84 | Exceptional 9.9% |
| New Zealanders | 97.8 /100 | #85 | Exceptional 9.9% |
| Immigrants | Vietnam | 97.5 /100 | #86 | Exceptional 10.0% |
| Immigrants | Oceania | 97.4 /100 | #87 | Exceptional 10.0% |
| Poles | 97.1 /100 | #88 | Exceptional 10.0% |
| Macedonians | 97.0 /100 | #89 | Exceptional 10.0% |
| Chileans | 97.0 /100 | #90 | Exceptional 10.0% |
| Bhutanese | 96.9 /100 | #91 | Exceptional 10.0% |