Guatemalan vs Yup'ik Unemployment Among Ages 16 to 19 years
COMPARE
Guatemalan
Yup'ik
Unemployment Among Ages 16 to 19 years
Unemployment Among Ages 16 to 19 years Comparison
Guatemalans
Yup'ik
18.6%
UNEMPLOYMENT AMONG AGES 16 TO 19 YEARS
0.8/ 100
METRIC RATING
244th/ 347
METRIC RANK
41.0%
UNEMPLOYMENT AMONG AGES 16 TO 19 YEARS
0.0/ 100
METRIC RATING
347th/ 347
METRIC RANK
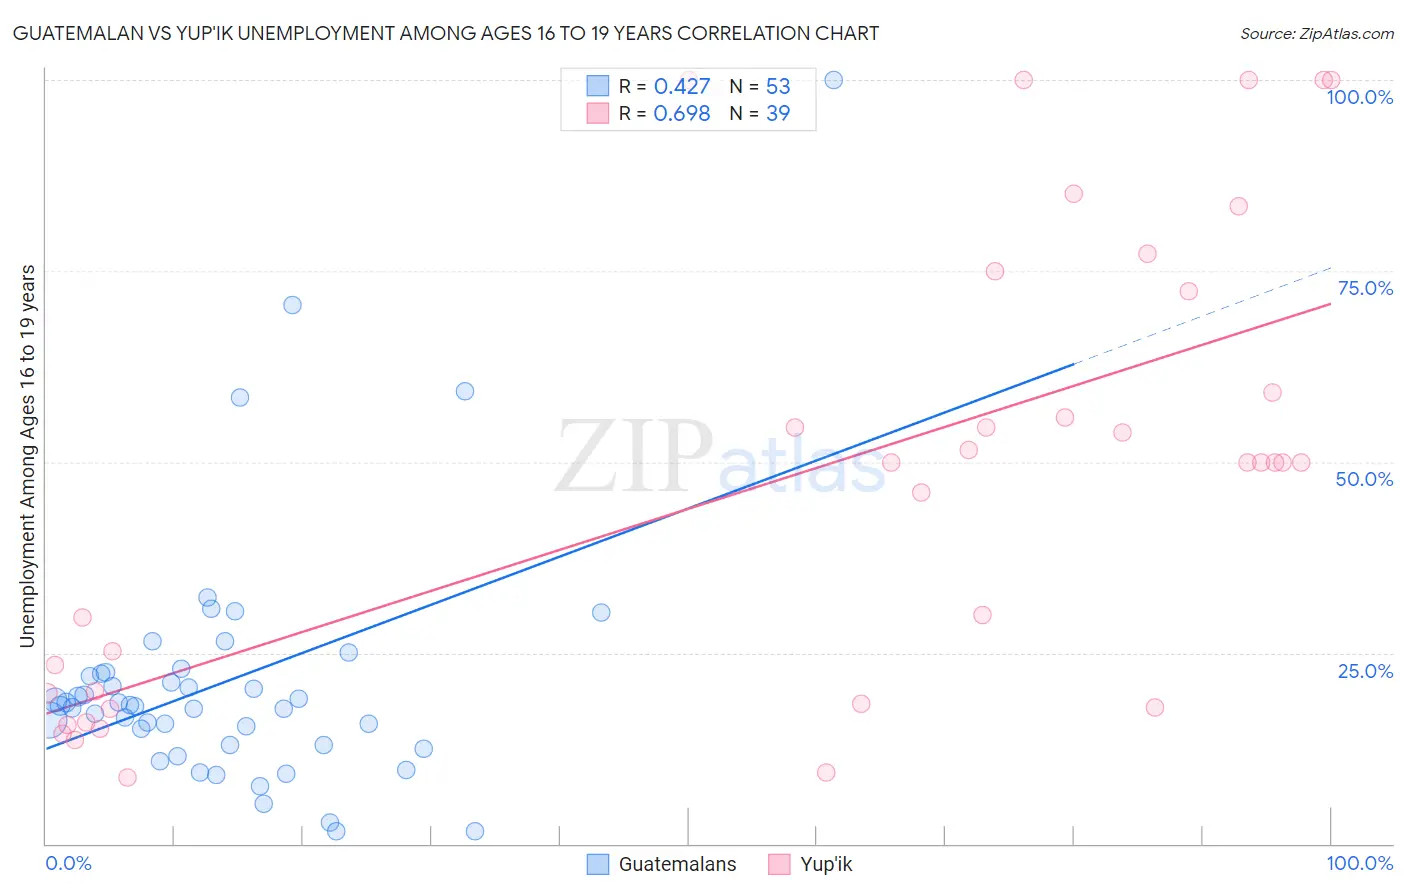
Guatemalan vs Yup'ik Unemployment Among Ages 16 to 19 years Correlation Chart
The statistical analysis conducted on geographies consisting of 390,544,351 people shows a moderate positive correlation between the proportion of Guatemalans and unemployment rate among population between the ages 16 and 19 in the United States with a correlation coefficient (R) of 0.427 and weighted average of 18.6%. Similarly, the statistical analysis conducted on geographies consisting of 39,366,389 people shows a significant positive correlation between the proportion of Yup'ik and unemployment rate among population between the ages 16 and 19 in the United States with a correlation coefficient (R) of 0.698 and weighted average of 41.0%, a difference of 120.4%.
Unemployment Among Ages 16 to 19 years Correlation Summary
| Measurement | Guatemalan | Yup'ik |
| Minimum | 1.7% | 8.7% |
| Maximum | 100.0% | 100.0% |
| Range | 98.3% | 91.3% |
| Mean | 21.3% | 47.8% |
| Median | 18.1% | 50.0% |
| Interquartile 25% (IQ1) | 12.9% | 18.4% |
| Interquartile 75% (IQ3) | 22.4% | 72.3% |
| Interquartile Range (IQR) | 9.4% | 53.9% |
| Standard Deviation (Sample) | 16.9% | 29.6% |
| Standard Deviation (Population) | 16.7% | 29.2% |
Similar Demographics by Unemployment Among Ages 16 to 19 years
Demographics Similar to Guatemalans by Unemployment Among Ages 16 to 19 years
In terms of unemployment among ages 16 to 19 years, the demographic groups most similar to Guatemalans are Immigrants from Belarus (18.6%, a difference of 0.010%), Mexican (18.5%, a difference of 0.21%), Moroccan (18.5%, a difference of 0.37%), Immigrants from South America (18.7%, a difference of 0.43%), and Immigrants from Israel (18.7%, a difference of 0.48%).
| Demographics | Rating | Rank | Unemployment Among Ages 16 to 19 years |
| Immigrants | Immigrants | 2.7 /100 | #237 | Tragic 18.3% |
| South Americans | 2.6 /100 | #238 | Tragic 18.3% |
| Native Hawaiians | 2.4 /100 | #239 | Tragic 18.3% |
| Immigrants | Cabo Verde | 2.0 /100 | #240 | Tragic 18.4% |
| Immigrants | Ukraine | 1.3 /100 | #241 | Tragic 18.5% |
| Moroccans | 1.1 /100 | #242 | Tragic 18.5% |
| Mexicans | 0.9 /100 | #243 | Tragic 18.5% |
| Guatemalans | 0.8 /100 | #244 | Tragic 18.6% |
| Immigrants | Belarus | 0.8 /100 | #245 | Tragic 18.6% |
| Immigrants | South America | 0.5 /100 | #246 | Tragic 18.7% |
| Immigrants | Israel | 0.5 /100 | #247 | Tragic 18.7% |
| Delaware | 0.5 /100 | #248 | Tragic 18.7% |
| Puget Sound Salish | 0.5 /100 | #249 | Tragic 18.7% |
| Panamanians | 0.4 /100 | #250 | Tragic 18.7% |
| Sub-Saharan Africans | 0.4 /100 | #251 | Tragic 18.7% |
Demographics Similar to Yup'ik by Unemployment Among Ages 16 to 19 years
In terms of unemployment among ages 16 to 19 years, the demographic groups most similar to Yup'ik are Yuman (37.4%, a difference of 9.5%), Hopi (30.7%, a difference of 33.6%), Colville (29.7%, a difference of 38.1%), Navajo (29.0%, a difference of 41.1%), and Inupiat (28.1%, a difference of 46.0%).
| Demographics | Rating | Rank | Unemployment Among Ages 16 to 19 years |
| Paiute | 0.0 /100 | #333 | Tragic 24.4% |
| Guyanese | 0.0 /100 | #334 | Tragic 24.8% |
| Arapaho | 0.0 /100 | #335 | Tragic 25.2% |
| Kiowa | 0.0 /100 | #336 | Tragic 25.2% |
| Immigrants | Guyana | 0.0 /100 | #337 | Tragic 25.5% |
| Immigrants | St. Vincent and the Grenadines | 0.0 /100 | #338 | Tragic 25.7% |
| Immigrants | Grenada | 0.0 /100 | #339 | Tragic 25.7% |
| Crow | 0.0 /100 | #340 | Tragic 26.2% |
| Puerto Ricans | 0.0 /100 | #341 | Tragic 27.5% |
| Inupiat | 0.0 /100 | #342 | Tragic 28.1% |
| Navajo | 0.0 /100 | #343 | Tragic 29.0% |
| Colville | 0.0 /100 | #344 | Tragic 29.7% |
| Hopi | 0.0 /100 | #345 | Tragic 30.7% |
| Yuman | 0.0 /100 | #346 | Tragic 37.4% |
| Yup'ik | 0.0 /100 | #347 | Tragic 41.0% |