Immigrants from Turkey vs Immigrants from Sudan Unemployment Among Ages 16 to 19 years

COMPARE

Immigrants from Turkey
Race
Ancestry
AfghanAfricanAlaska NativeAlaskan AthabascanAlbanianAleutAlsatianAmericanApacheArabArapahoArgentineanArmenianAssyrian/Chaldean/SyriacAustralianAustrianBahamianBangladeshiBarbadianBasqueBelgianBelizeanBermudanBhutaneseBlackfeetBolivianBrazilianBritishBritish West IndianBulgarianBurmeseCajunCambodianCanadianCape VerdeanCarpatho RusynCelticCentral AmericanCentral American IndianCherokeeCheyenneChickasawChileanChineseChippewaChoctawColombianColvilleComancheCosta RicanCreeCreekCroatianCrowCubanCypriotCzechCzechoslovakianDanishDelawareDominicanDutchDutch West IndianEastern EuropeanEcuadorianEgyptianEnglishEstonianEthiopianEuropeanFijianFilipinoFinnishFrenchFrench American IndianFrench CanadianGermanGerman RussianGhanaianGreekGuamanian/ChamorroGuatemalanGuyaneseHaitianHmongHonduranHopiHoumaHungarianIcelanderIndian (Asian)IndonesianInupiatIranianIraqiIrishIroquoisIsraeliItalianJamaicanJapaneseJordanianKenyanKiowaKoreanLaotianLatvianLebaneseLiberianLithuanianLumbeeLuxembourgerMacedonianMalaysianMalteseMarshalleseMenomineeMexicanMexican American IndianMongolianMoroccanNative HawaiianNavajoNepaleseNew ZealanderNicaraguanNigerianNorthern EuropeanNorwegianOkinawanOsageOttawaPaiutePakistaniPalestinianPanamanianParaguayanPennsylvania GermanPeruvianPimaPolishPortuguesePotawatomiPuebloPuerto RicanPuget Sound SalishRomanianRussianSalvadoranSamoanScandinavianScotch-IrishScottishSeminoleSenegaleseSerbianShoshoneSierra LeoneanSiouxSlavicSlovakSloveneSomaliSouth AfricanSouth AmericanSouth American IndianSoviet UnionSpaniardSpanishSpanish AmericanSpanish American IndianSri LankanSubsaharan AfricanSudaneseSwedishSwissSyrianTaiwaneseThaiTlingit-HaidaTohono O'OdhamTonganTrinidadian and TobagonianTsimshianTurkishU.S. Virgin IslanderUgandanUkrainianUruguayanUteVenezuelanVietnameseWelshWest IndianYakamaYaquiYugoslavianYumanYup'ikZimbabwean
Immigration
NonimmigrantsImmigrantsAfghanistanAfricaAlbaniaArgentinaArmeniaAsiaAustraliaAustriaBahamasBangladeshBarbadosBelarusBelgiumBelizeBoliviaBosnia and HerzegovinaBrazilBulgariaBurma/MyanmarCabo VerdeCambodiaCameroonCanadaCaribbeanCentral AmericaChileChinaColombiaCongoCosta RicaCroatiaCubaCzechoslovakiaDenmarkDominicaDominican RepublicEastern AfricaEastern AsiaEastern EuropeEcuadorEgyptEl SalvadorEnglandEritreaEthiopiaEuropeFijiFranceGermanyGhanaGreeceGrenadaGuatemalaGuyanaHaitiHondurasHong KongHungaryIndiaIndonesiaIranIraqIrelandIsraelItalyJamaicaJapanJordanKazakhstanKenyaKoreaKuwaitLaosLatin AmericaLatviaLebanonLiberiaLithuaniaMalaysiaMexicoMicronesiaMiddle AfricaMoldovaMoroccoNepalNetherlandsNicaraguaNigeriaNorth AmericaNorth MacedoniaNorthern AfricaNorthern EuropeNorwayOceaniaPakistanPanamaPeruPhilippinesPolandPortugalRomaniaRussiaSaudi ArabiaScotlandSenegalSerbiaSierra LeoneSingaporeSomaliaSouth AfricaSouth AmericaSouth Central AsiaSouth Eastern AsiaSouthern EuropeSpainSri LankaSt. Vincent and the GrenadinesSwedenSwitzerlandSyriaTaiwanThailandTrinidad and TobagoTurkeyUgandaUkraineUruguayUzbekistanVenezuelaVietnamWest IndiesWestern AfricaWestern AsiaWestern EuropeYemenZaireZimbabweAzores
Immigrants from Sudan
Race
Ancestry
AfghanAfricanAlaska NativeAlaskan AthabascanAlbanianAleutAlsatianAmericanApacheArabArapahoArgentineanArmenianAssyrian/Chaldean/SyriacAustralianAustrianBahamianBangladeshiBarbadianBasqueBelgianBelizeanBermudanBhutaneseBlackfeetBolivianBrazilianBritishBritish West IndianBulgarianBurmeseCajunCambodianCanadianCape VerdeanCarpatho RusynCelticCentral AmericanCentral American IndianCherokeeCheyenneChickasawChileanChineseChippewaChoctawColombianColvilleComancheCosta RicanCreeCreekCroatianCrowCubanCypriotCzechCzechoslovakianDanishDelawareDominicanDutchDutch West IndianEastern EuropeanEcuadorianEgyptianEnglishEstonianEthiopianEuropeanFijianFilipinoFinnishFrenchFrench American IndianFrench CanadianGermanGerman RussianGhanaianGreekGuamanian/ChamorroGuatemalanGuyaneseHaitianHmongHonduranHopiHoumaHungarianIcelanderIndian (Asian)IndonesianInupiatIranianIraqiIrishIroquoisIsraeliItalianJamaicanJapaneseJordanianKenyanKiowaKoreanLaotianLatvianLebaneseLiberianLithuanianLumbeeLuxembourgerMacedonianMalaysianMalteseMarshalleseMenomineeMexicanMexican American IndianMongolianMoroccanNative HawaiianNavajoNepaleseNew ZealanderNicaraguanNigerianNorthern EuropeanNorwegianOkinawanOsageOttawaPaiutePakistaniPalestinianPanamanianParaguayanPennsylvania GermanPeruvianPimaPolishPortuguesePotawatomiPuebloPuerto RicanPuget Sound SalishRomanianRussianSalvadoranSamoanScandinavianScotch-IrishScottishSeminoleSenegaleseSerbianShoshoneSierra LeoneanSiouxSlavicSlovakSloveneSomaliSouth AfricanSouth AmericanSouth American IndianSoviet UnionSpaniardSpanishSpanish AmericanSpanish American IndianSri LankanSubsaharan AfricanSudaneseSwedishSwissSyrianTaiwaneseThaiTlingit-HaidaTohono O'OdhamTonganTrinidadian and TobagonianTsimshianTurkishU.S. Virgin IslanderUgandanUkrainianUruguayanUteVenezuelanVietnameseWelshWest IndianYakamaYaquiYugoslavianYumanYup'ikZimbabwean
Immigration
NonimmigrantsImmigrantsAfghanistanAfricaAlbaniaArgentinaArmeniaAsiaAustraliaAustriaBahamasBangladeshBarbadosBelarusBelgiumBelizeBoliviaBosnia and HerzegovinaBrazilBulgariaBurma/MyanmarCabo VerdeCambodiaCameroonCanadaCaribbeanCentral AmericaChileChinaColombiaCongoCosta RicaCroatiaCubaCzechoslovakiaDenmarkDominicaDominican RepublicEastern AfricaEastern AsiaEastern EuropeEcuadorEgyptEl SalvadorEnglandEritreaEthiopiaEuropeFijiFranceGermanyGhanaGreeceGrenadaGuatemalaGuyanaHaitiHondurasHong KongHungaryIndiaIndonesiaIranIraqIrelandIsraelItalyJamaicaJapanJordanKazakhstanKenyaKoreaKuwaitLaosLatin AmericaLatviaLebanonLiberiaLithuaniaMalaysiaMexicoMicronesiaMiddle AfricaMoldovaMoroccoNepalNetherlandsNicaraguaNigeriaNorth AmericaNorth MacedoniaNorthern AfricaNorthern EuropeNorwayOceaniaPakistanPanamaPeruPhilippinesPolandPortugalRomaniaRussiaSaudi ArabiaScotlandSenegalSerbiaSierra LeoneSingaporeSomaliaSouth AfricaSouth AmericaSouth Central AsiaSouth Eastern AsiaSouthern EuropeSpainSri LankaSt. Vincent and the GrenadinesSudanSwedenSwitzerlandSyriaTaiwanThailandTrinidad and TobagoUgandaUkraineUruguayUzbekistanVenezuelaVietnamWest IndiesWestern AfricaWestern AsiaWestern EuropeYemenZaireZimbabweAzores
Unemployment Among Ages 16 to 19 years
Income
Poverty
Unemployment
Labor Participation
Family Structure
Vehicle Availability
Education Level
Disability

Unemployment Among Ages 16 to 19 years Comparison

Immigrants from Turkey

Immigrants from Sudan

Average
Exceptional
17.6%
UNEMPLOYMENT AMONG AGES 16 TO 19 YEARS
45.6/ 100
METRIC RATING
181st/ 347
METRIC RANK
16.0%
UNEMPLOYMENT AMONG AGES 16 TO 19 YEARS
99.9/ 100
METRIC RATING
27th/ 347
METRIC RANK

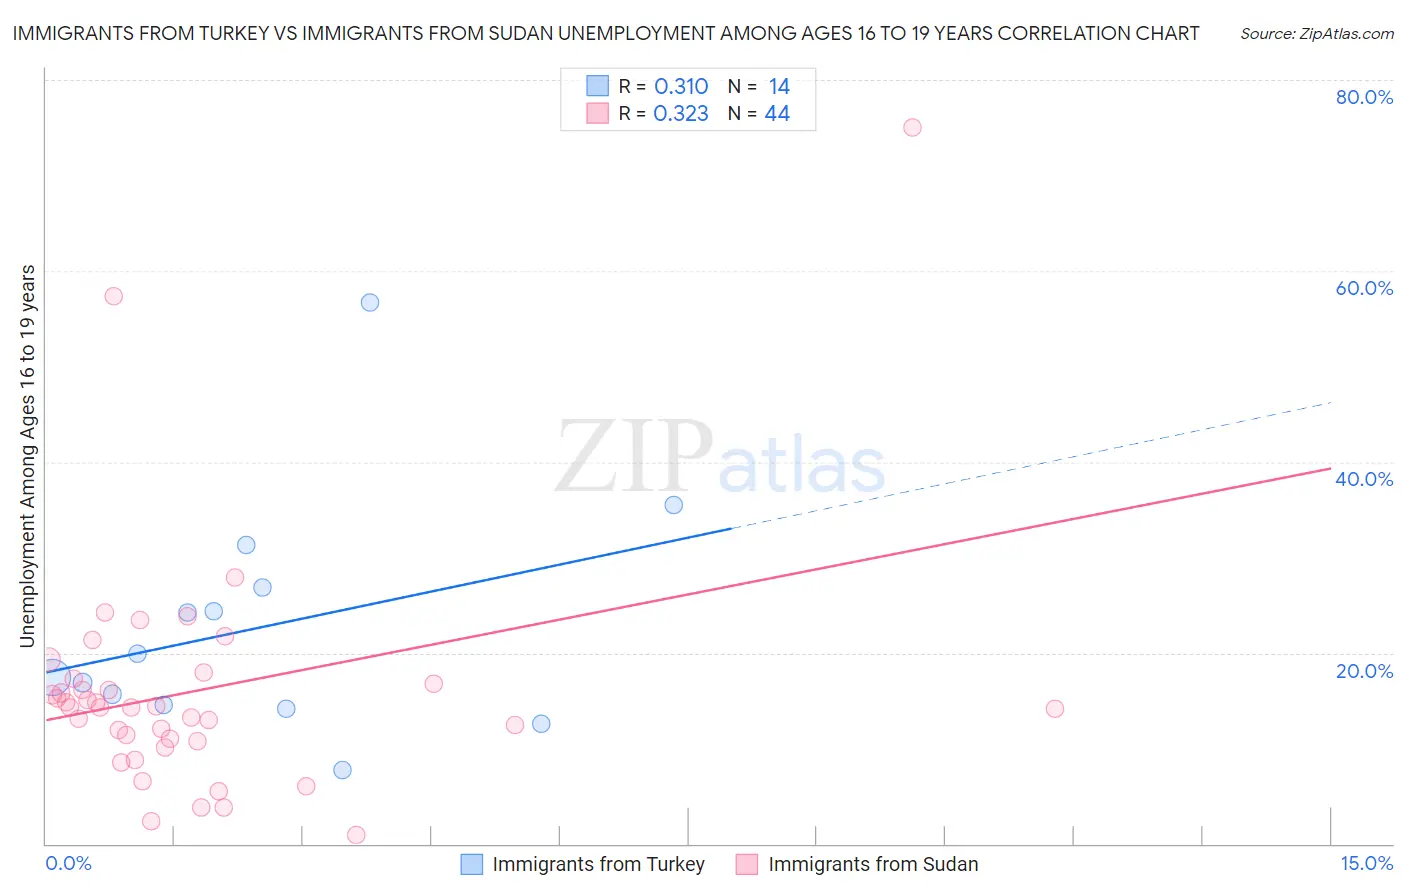
Immigrants from Turkey vs Immigrants from Sudan Unemployment Among Ages 16 to 19 years Correlation Chart

The statistical analysis conducted on geographies consisting of 215,488,732 people shows a mild positive correlation between the proportion of Immigrants from Turkey and unemployment rate among population between the ages 16 and 19 in the United States with a correlation coefficient (R) of 0.310 and weighted average of 17.6%. Similarly, the statistical analysis conducted on geographies consisting of 117,284,224 people shows a mild positive correlation between the proportion of Immigrants from Sudan and unemployment rate among population between the ages 16 and 19 in the United States with a correlation coefficient (R) of 0.323 and weighted average of 16.0%, a difference of 10.0%.
Immigrants from Turkey vs Immigrants from Sudan Unemployment Among Ages 16 to 19 years

Unemployment Among Ages 16 to 19 years Correlation Summary

MeasurementImmigrants from TurkeyImmigrants from Sudan
Minimum7.7%0.90%
Maximum56.7%75.0%
Range49.0%74.1%
Mean22.7%16.0%
Median18.7%14.3%
Interquartile 25% (IQ1)14.5%10.9%
Interquartile 75% (IQ3)26.8%17.0%
Interquartile Range (IQR)12.3%6.1%
Standard Deviation (Sample)12.4%12.7%
Standard Deviation (Population)12.0%12.5%

Similar Demographics by Unemployment Among Ages 16 to 19 years

Demographics Similar to Immigrants from Turkey by Unemployment Among Ages 16 to 19 years

In terms of unemployment among ages 16 to 19 years, the demographic groups most similar to Immigrants from Turkey are Russian (17.6%, a difference of 0.020%), Immigrants from Uruguay (17.6%, a difference of 0.050%), Eastern European (17.6%, a difference of 0.060%), Spaniard (17.6%, a difference of 0.070%), and American (17.6%, a difference of 0.090%).
DemographicsRating | RankUnemployment Among Ages 16 to 19 years
Osage
50.0
/100
|
#174
Average
17.6%
Immigrants | Sweden
49.1
/100
|
#175
Average
17.6%
Nicaraguans
48.9
/100
|
#176
Average
17.6%
Bermudans
48.7
/100
|
#177
Average
17.6%
Celtics
48.7
/100
|
#178
Average
17.6%
Americans
47.4
/100
|
#179
Average
17.6%
Spaniards
47.1
/100
|
#180
Average
17.6%
Immigrants | Turkey
45.6
/100
|
#181
Average
17.6%
Russians
45.2
/100
|
#182
Average
17.6%
Immigrants | Uruguay
44.6
/100
|
#183
Average
17.6%
Eastern Europeans
44.3
/100
|
#184
Average
17.6%
Iroquois
43.4
/100
|
#185
Average
17.6%
Japanese
43.2
/100
|
#186
Average
17.6%
Immigrants | Micronesia
42.4
/100
|
#187
Average
17.6%
Immigrants | Nicaragua
42.2
/100
|
#188
Average
17.6%

Demographics Similar to Immigrants from Sudan by Unemployment Among Ages 16 to 19 years

In terms of unemployment among ages 16 to 19 years, the demographic groups most similar to Immigrants from Sudan are Jordanian (16.0%, a difference of 0.18%), Chinese (16.0%, a difference of 0.23%), Kenyan (16.1%, a difference of 0.27%), English (16.1%, a difference of 0.32%), and Dutch (15.9%, a difference of 0.47%).
DemographicsRating | RankUnemployment Among Ages 16 to 19 years
Sudanese
100.0
/100
|
#20
Exceptional
15.8%
Immigrants | Taiwan
100.0
/100
|
#21
Exceptional
15.8%
Finns
100.0
/100
|
#22
Exceptional
15.9%
Belgians
100.0
/100
|
#23
Exceptional
15.9%
Tongans
100.0
/100
|
#24
Exceptional
15.9%
Filipinos
100.0
/100
|
#25
Exceptional
15.9%
Dutch
100.0
/100
|
#26
Exceptional
15.9%
Immigrants | Sudan
99.9
/100
|
#27
Exceptional
16.0%
Jordanians
99.9
/100
|
#28
Exceptional
16.0%
Chinese
99.9
/100
|
#29
Exceptional
16.0%
Kenyans
99.9
/100
|
#30
Exceptional
16.1%
English
99.9
/100
|
#31
Exceptional
16.1%
Europeans
99.9
/100
|
#32
Exceptional
16.1%
Immigrants | Kenya
99.9
/100
|
#33
Exceptional
16.2%
Pennsylvania Germans
99.9
/100
|
#34
Exceptional
16.2%