Immigrants from Lebanon vs Yaqui Unemployment Among Ages 30 to 34 years
COMPARE
Immigrants from Lebanon
Yaqui
Unemployment Among Ages 30 to 34 years
Unemployment Among Ages 30 to 34 years Comparison
Immigrants from Lebanon
Yaqui
5.5%
UNEMPLOYMENT AMONG AGES 30 TO 34 YEARS
43.5/ 100
METRIC RATING
181st/ 347
METRIC RANK
5.9%
UNEMPLOYMENT AMONG AGES 30 TO 34 YEARS
0.7/ 100
METRIC RATING
235th/ 347
METRIC RANK
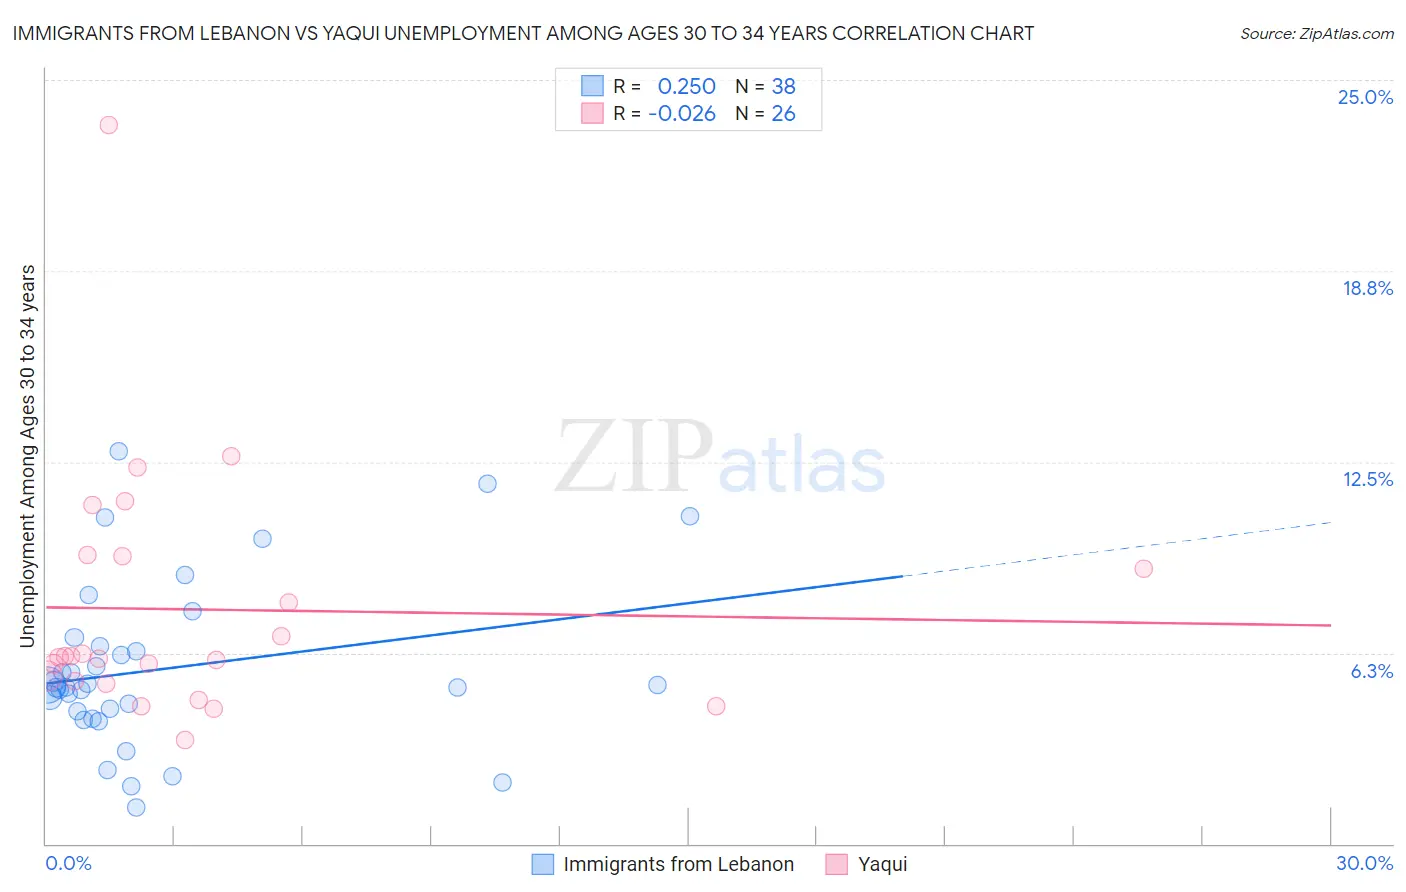
Immigrants from Lebanon vs Yaqui Unemployment Among Ages 30 to 34 years Correlation Chart
The statistical analysis conducted on geographies consisting of 210,846,341 people shows a weak positive correlation between the proportion of Immigrants from Lebanon and unemployment rate among population between the ages 30 and 34 in the United States with a correlation coefficient (R) of 0.250 and weighted average of 5.5%. Similarly, the statistical analysis conducted on geographies consisting of 106,044,835 people shows no correlation between the proportion of Yaqui and unemployment rate among population between the ages 30 and 34 in the United States with a correlation coefficient (R) of -0.026 and weighted average of 5.9%, a difference of 8.0%.
Unemployment Among Ages 30 to 34 years Correlation Summary
| Measurement | Immigrants from Lebanon | Yaqui |
| Minimum | 1.2% | 3.4% |
| Maximum | 12.8% | 23.5% |
| Range | 11.6% | 20.1% |
| Mean | 5.7% | 7.7% |
| Median | 5.2% | 6.1% |
| Interquartile 25% (IQ1) | 4.4% | 5.3% |
| Interquartile 75% (IQ3) | 6.4% | 9.4% |
| Interquartile Range (IQR) | 2.1% | 4.1% |
| Standard Deviation (Sample) | 2.7% | 4.1% |
| Standard Deviation (Population) | 2.7% | 4.0% |
Similar Demographics by Unemployment Among Ages 30 to 34 years
Demographics Similar to Immigrants from Lebanon by Unemployment Among Ages 30 to 34 years
In terms of unemployment among ages 30 to 34 years, the demographic groups most similar to Immigrants from Lebanon are Immigrants from Denmark (5.5%, a difference of 0.010%), Hungarian (5.5%, a difference of 0.030%), Malaysian (5.5%, a difference of 0.12%), Italian (5.5%, a difference of 0.14%), and Costa Rican (5.5%, a difference of 0.23%).
| Demographics | Rating | Rank | Unemployment Among Ages 30 to 34 years |
| Immigrants | Laos | 50.0 /100 | #174 | Average 5.5% |
| Afghans | 49.6 /100 | #175 | Average 5.5% |
| Immigrants | Peru | 48.0 /100 | #176 | Average 5.5% |
| Immigrants | Ukraine | 47.7 /100 | #177 | Average 5.5% |
| Macedonians | 47.1 /100 | #178 | Average 5.5% |
| Costa Ricans | 46.7 /100 | #179 | Average 5.5% |
| Italians | 45.5 /100 | #180 | Average 5.5% |
| Immigrants | Lebanon | 43.5 /100 | #181 | Average 5.5% |
| Immigrants | Denmark | 43.4 /100 | #182 | Average 5.5% |
| Hungarians | 43.1 /100 | #183 | Average 5.5% |
| Malaysians | 41.8 /100 | #184 | Average 5.5% |
| Immigrants | Western Europe | 39.1 /100 | #185 | Fair 5.5% |
| Canadians | 38.2 /100 | #186 | Fair 5.5% |
| Immigrants | Western Asia | 38.2 /100 | #187 | Fair 5.5% |
| Immigrants | Norway | 36.1 /100 | #188 | Fair 5.5% |
Demographics Similar to Yaqui by Unemployment Among Ages 30 to 34 years
In terms of unemployment among ages 30 to 34 years, the demographic groups most similar to Yaqui are Portuguese (5.9%, a difference of 0.12%), Native Hawaiian (5.9%, a difference of 0.12%), Nepalese (5.9%, a difference of 0.15%), Central American (5.9%, a difference of 0.29%), and Mexican American Indian (5.9%, a difference of 0.38%).
| Demographics | Rating | Rank | Unemployment Among Ages 30 to 34 years |
| Immigrants | Bahamas | 1.8 /100 | #228 | Tragic 5.8% |
| Immigrants | Uzbekistan | 1.5 /100 | #229 | Tragic 5.9% |
| Hawaiians | 1.2 /100 | #230 | Tragic 5.9% |
| Japanese | 1.1 /100 | #231 | Tragic 5.9% |
| Iroquois | 1.0 /100 | #232 | Tragic 5.9% |
| Nepalese | 0.8 /100 | #233 | Tragic 5.9% |
| Portuguese | 0.8 /100 | #234 | Tragic 5.9% |
| Yaqui | 0.7 /100 | #235 | Tragic 5.9% |
| Native Hawaiians | 0.7 /100 | #236 | Tragic 5.9% |
| Central Americans | 0.6 /100 | #237 | Tragic 5.9% |
| Mexican American Indians | 0.6 /100 | #238 | Tragic 5.9% |
| Immigrants | Nigeria | 0.6 /100 | #239 | Tragic 6.0% |
| Salvadorans | 0.5 /100 | #240 | Tragic 6.0% |
| Immigrants | El Salvador | 0.5 /100 | #241 | Tragic 6.0% |
| Guatemalans | 0.4 /100 | #242 | Tragic 6.0% |