Korean vs Immigrants from Chile Unemployment Among Ages 60 to 64 years
COMPARE
Korean
Immigrants from Chile
Unemployment Among Ages 60 to 64 years
Unemployment Among Ages 60 to 64 years Comparison
Koreans
Immigrants from Chile
4.9%
UNEMPLOYMENT AMONG AGES 60 TO 64 YEARS
12.2/ 100
METRIC RATING
217th/ 347
METRIC RANK
5.0%
UNEMPLOYMENT AMONG AGES 60 TO 64 YEARS
6.8/ 100
METRIC RATING
226th/ 347
METRIC RANK
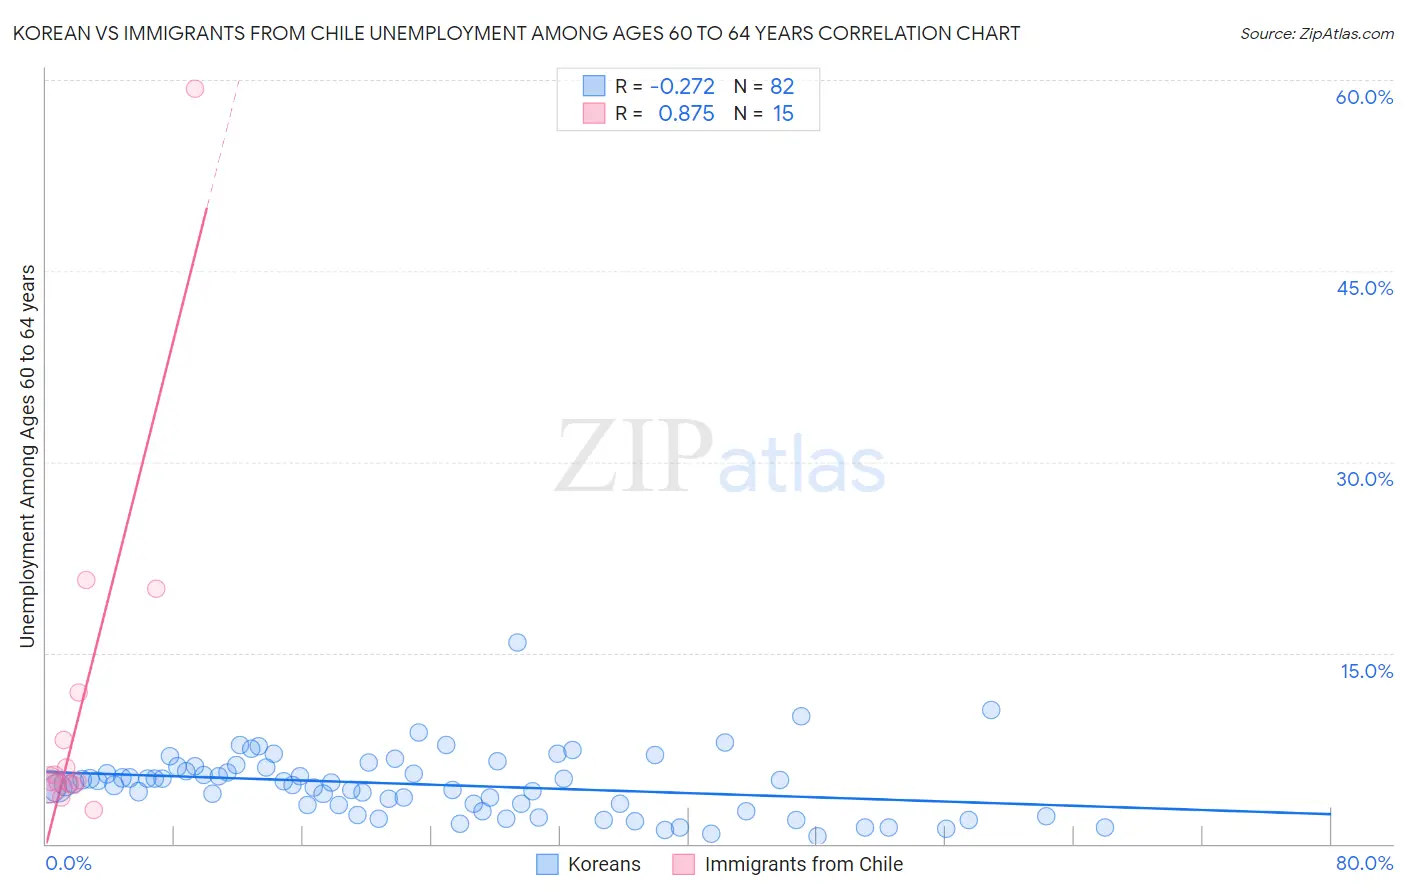
Korean vs Immigrants from Chile Unemployment Among Ages 60 to 64 years Correlation Chart
The statistical analysis conducted on geographies consisting of 440,560,211 people shows a weak negative correlation between the proportion of Koreans and unemployment rate among population between the ages 60 and 64 in the United States with a correlation coefficient (R) of -0.272 and weighted average of 4.9%. Similarly, the statistical analysis conducted on geographies consisting of 209,441,253 people shows a very strong positive correlation between the proportion of Immigrants from Chile and unemployment rate among population between the ages 60 and 64 in the United States with a correlation coefficient (R) of 0.875 and weighted average of 5.0%, a difference of 0.56%.
Unemployment Among Ages 60 to 64 years Correlation Summary
| Measurement | Korean | Immigrants from Chile |
| Minimum | 0.60% | 2.7% |
| Maximum | 15.8% | 59.3% |
| Range | 15.2% | 56.6% |
| Mean | 4.7% | 11.1% |
| Median | 4.8% | 5.0% |
| Interquartile 25% (IQ1) | 3.0% | 4.6% |
| Interquartile 75% (IQ3) | 6.0% | 11.9% |
| Interquartile Range (IQR) | 3.0% | 7.2% |
| Standard Deviation (Sample) | 2.5% | 14.5% |
| Standard Deviation (Population) | 2.5% | 14.0% |
Demographics Similar to Koreans and Immigrants from Chile by Unemployment Among Ages 60 to 64 years
In terms of unemployment among ages 60 to 64 years, the demographic groups most similar to Koreans are Cajun (4.9%, a difference of 0.010%), Immigrants from Singapore (4.9%, a difference of 0.010%), Immigrants from Brazil (4.9%, a difference of 0.040%), Ottawa (4.9%, a difference of 0.050%), and Immigrants from South Eastern Asia (4.9%, a difference of 0.070%). Similarly, the demographic groups most similar to Immigrants from Chile are Nigerian (5.0%, a difference of 0.0%), Immigrants from Ireland (5.0%, a difference of 0.050%), Immigrants from Belarus (5.0%, a difference of 0.060%), African (5.0%, a difference of 0.13%), and Immigrants from Denmark (5.0%, a difference of 0.15%).
| Demographics | Rating | Rank | Unemployment Among Ages 60 to 64 years |
| Blackfeet | 15.7 /100 | #211 | Poor 4.9% |
| Moroccans | 15.0 /100 | #212 | Poor 4.9% |
| Eastern Europeans | 14.3 /100 | #213 | Poor 4.9% |
| Immigrants | Russia | 13.7 /100 | #214 | Poor 4.9% |
| Immigrants | South Eastern Asia | 13.1 /100 | #215 | Poor 4.9% |
| Cajuns | 12.3 /100 | #216 | Poor 4.9% |
| Koreans | 12.2 /100 | #217 | Poor 4.9% |
| Immigrants | Singapore | 12.0 /100 | #218 | Poor 4.9% |
| Immigrants | Brazil | 11.7 /100 | #219 | Poor 4.9% |
| Ottawa | 11.6 /100 | #220 | Poor 4.9% |
| Ugandans | 10.5 /100 | #221 | Poor 4.9% |
| Brazilians | 10.1 /100 | #222 | Poor 5.0% |
| Crow | 9.7 /100 | #223 | Tragic 5.0% |
| Immigrants | Cameroon | 8.5 /100 | #224 | Tragic 5.0% |
| Immigrants | Ireland | 7.2 /100 | #225 | Tragic 5.0% |
| Immigrants | Chile | 6.8 /100 | #226 | Tragic 5.0% |
| Nigerians | 6.8 /100 | #227 | Tragic 5.0% |
| Immigrants | Belarus | 6.4 /100 | #228 | Tragic 5.0% |
| Africans | 5.9 /100 | #229 | Tragic 5.0% |
| Immigrants | Denmark | 5.8 /100 | #230 | Tragic 5.0% |
| Tohono O'odham | 5.7 /100 | #231 | Tragic 5.0% |