Immigrants from Mexico vs Brazilian Unemployment Among Ages 25 to 29 years
COMPARE
Immigrants from Mexico
Brazilian
Unemployment Among Ages 25 to 29 years
Unemployment Among Ages 25 to 29 years Comparison
Immigrants from Mexico
Brazilians
7.6%
UNEMPLOYMENT AMONG AGES 25 TO 29 YEARS
0.0/ 100
METRIC RATING
287th/ 347
METRIC RANK
6.5%
UNEMPLOYMENT AMONG AGES 25 TO 29 YEARS
81.9/ 100
METRIC RATING
126th/ 347
METRIC RANK
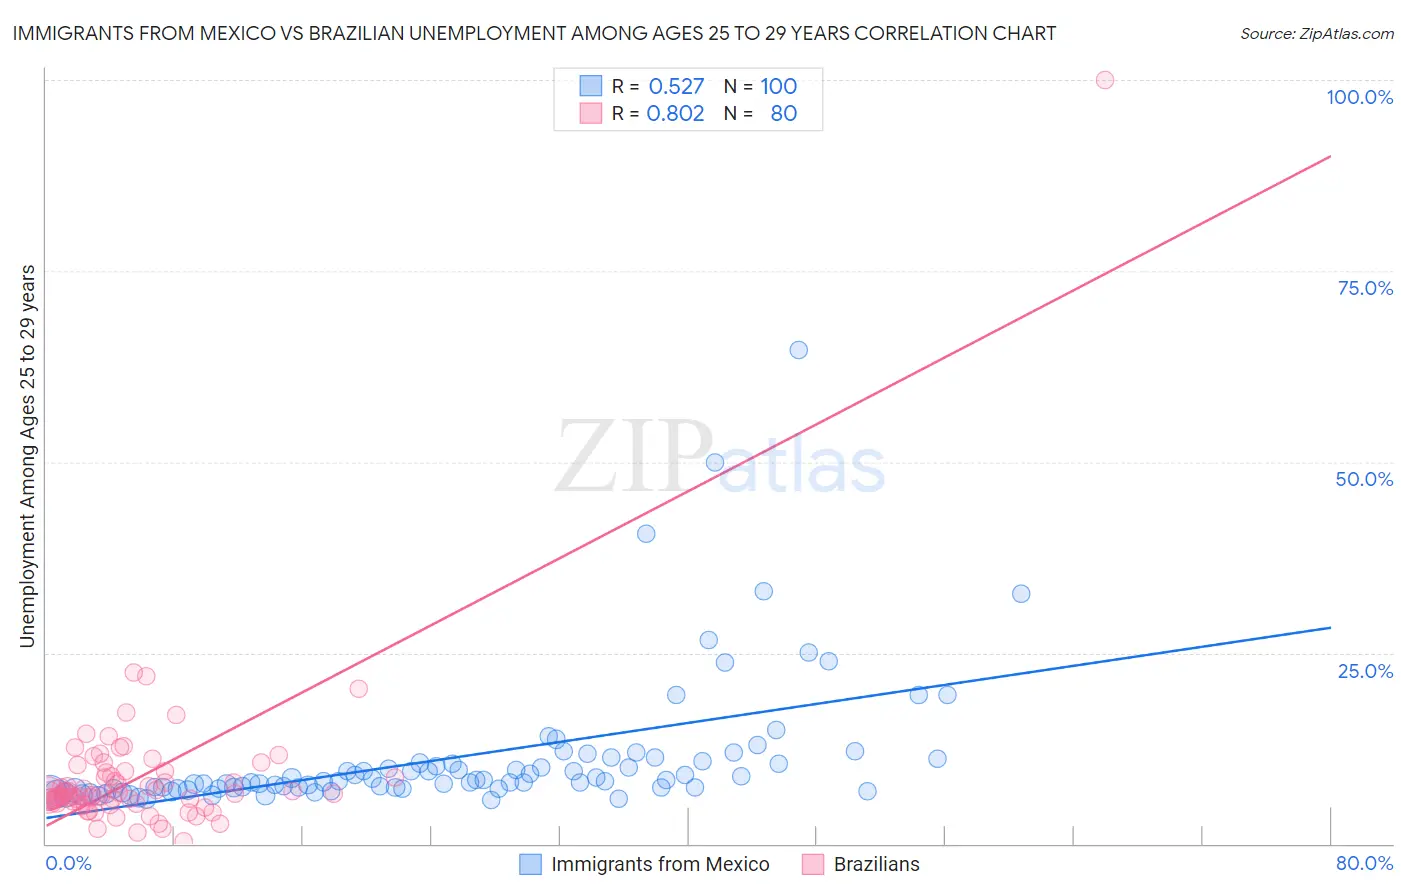
Immigrants from Mexico vs Brazilian Unemployment Among Ages 25 to 29 years Correlation Chart
The statistical analysis conducted on geographies consisting of 471,781,188 people shows a substantial positive correlation between the proportion of Immigrants from Mexico and unemployment rate among population between the ages 25 and 29 in the United States with a correlation coefficient (R) of 0.527 and weighted average of 7.6%. Similarly, the statistical analysis conducted on geographies consisting of 311,458,460 people shows a very strong positive correlation between the proportion of Brazilians and unemployment rate among population between the ages 25 and 29 in the United States with a correlation coefficient (R) of 0.802 and weighted average of 6.5%, a difference of 17.6%.
Unemployment Among Ages 25 to 29 years Correlation Summary
| Measurement | Immigrants from Mexico | Brazilian |
| Minimum | 5.8% | 0.40% |
| Maximum | 64.6% | 100.0% |
| Range | 58.8% | 99.6% |
| Mean | 11.3% | 8.8% |
| Median | 8.2% | 6.5% |
| Interquartile 25% (IQ1) | 7.3% | 5.4% |
| Interquartile 75% (IQ3) | 10.7% | 9.5% |
| Interquartile Range (IQR) | 3.5% | 4.0% |
| Standard Deviation (Sample) | 9.0% | 11.2% |
| Standard Deviation (Population) | 9.0% | 11.1% |
Similar Demographics by Unemployment Among Ages 25 to 29 years
Demographics Similar to Immigrants from Mexico by Unemployment Among Ages 25 to 29 years
In terms of unemployment among ages 25 to 29 years, the demographic groups most similar to Immigrants from Mexico are African (7.6%, a difference of 0.060%), Vietnamese (7.6%, a difference of 0.59%), Senegalese (7.6%, a difference of 0.68%), Belizean (7.7%, a difference of 0.77%), and Cherokee (7.6%, a difference of 0.80%).
| Demographics | Rating | Rank | Unemployment Among Ages 25 to 29 years |
| Immigrants | Caribbean | 0.0 /100 | #280 | Tragic 7.5% |
| Immigrants | Bangladesh | 0.0 /100 | #281 | Tragic 7.5% |
| Immigrants | Senegal | 0.0 /100 | #282 | Tragic 7.6% |
| Creek | 0.0 /100 | #283 | Tragic 7.6% |
| Cherokee | 0.0 /100 | #284 | Tragic 7.6% |
| Senegalese | 0.0 /100 | #285 | Tragic 7.6% |
| Vietnamese | 0.0 /100 | #286 | Tragic 7.6% |
| Immigrants | Mexico | 0.0 /100 | #287 | Tragic 7.6% |
| Africans | 0.0 /100 | #288 | Tragic 7.6% |
| Belizeans | 0.0 /100 | #289 | Tragic 7.7% |
| Armenians | 0.0 /100 | #290 | Tragic 7.7% |
| Hispanics or Latinos | 0.0 /100 | #291 | Tragic 7.7% |
| Chippewa | 0.0 /100 | #292 | Tragic 7.8% |
| Immigrants | Belize | 0.0 /100 | #293 | Tragic 7.8% |
| Trinidadians and Tobagonians | 0.0 /100 | #294 | Tragic 7.8% |
Demographics Similar to Brazilians by Unemployment Among Ages 25 to 29 years
In terms of unemployment among ages 25 to 29 years, the demographic groups most similar to Brazilians are Syrian (6.5%, a difference of 0.020%), Arab (6.5%, a difference of 0.060%), Dutch (6.5%, a difference of 0.13%), Immigrants from Chile (6.5%, a difference of 0.15%), and Sri Lankan (6.5%, a difference of 0.17%).
| Demographics | Rating | Rank | Unemployment Among Ages 25 to 29 years |
| Immigrants | South Africa | 84.9 /100 | #119 | Excellent 6.5% |
| Immigrants | Moldova | 84.5 /100 | #120 | Excellent 6.5% |
| Immigrants | Uganda | 84.5 /100 | #121 | Excellent 6.5% |
| Immigrants | Belarus | 83.7 /100 | #122 | Excellent 6.5% |
| Laotians | 83.6 /100 | #123 | Excellent 6.5% |
| Arabs | 82.5 /100 | #124 | Excellent 6.5% |
| Syrians | 82.1 /100 | #125 | Excellent 6.5% |
| Brazilians | 81.9 /100 | #126 | Excellent 6.5% |
| Dutch | 80.6 /100 | #127 | Excellent 6.5% |
| Immigrants | Chile | 80.5 /100 | #128 | Excellent 6.5% |
| Sri Lankans | 80.3 /100 | #129 | Excellent 6.5% |
| Immigrants | Peru | 79.9 /100 | #130 | Good 6.5% |
| Immigrants | Afghanistan | 79.2 /100 | #131 | Good 6.5% |
| Poles | 76.6 /100 | #132 | Good 6.5% |
| Immigrants | Europe | 75.7 /100 | #133 | Good 6.5% |