Greek vs Immigrants from West Indies Male Unemployment
COMPARE
Greek
Immigrants from West Indies
Male Unemployment
Male Unemployment Comparison
Greeks
Immigrants from West Indies
5.0%
MALE UNEMPLOYMENT
97.0/ 100
METRIC RATING
73rd/ 347
METRIC RANK
6.7%
MALE UNEMPLOYMENT
0.0/ 100
METRIC RATING
303rd/ 347
METRIC RANK
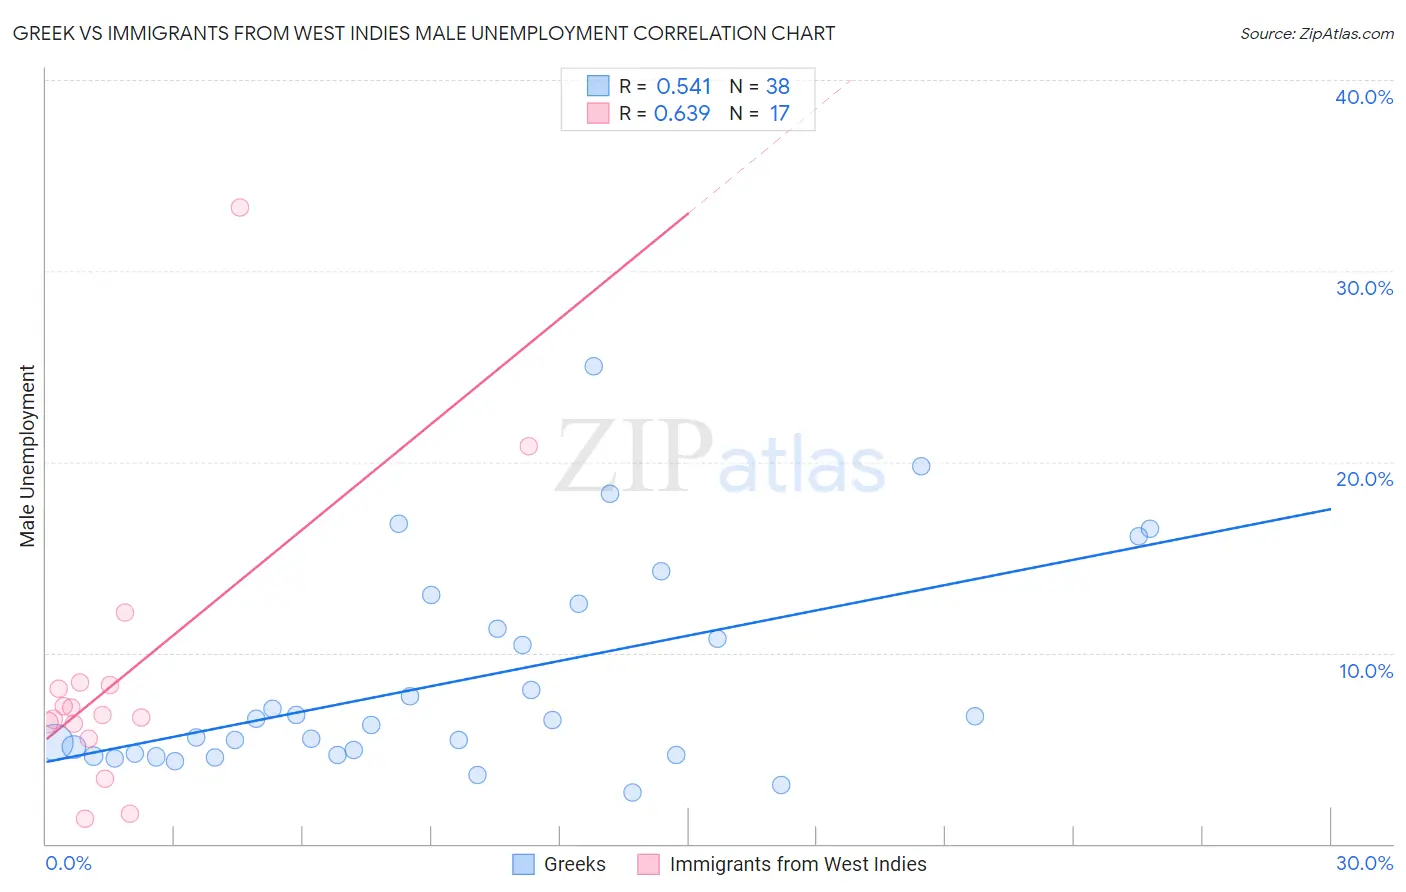
Greek vs Immigrants from West Indies Male Unemployment Correlation Chart
The statistical analysis conducted on geographies consisting of 479,076,268 people shows a substantial positive correlation between the proportion of Greeks and unemployment rate among males in the United States with a correlation coefficient (R) of 0.541 and weighted average of 5.0%. Similarly, the statistical analysis conducted on geographies consisting of 72,422,402 people shows a significant positive correlation between the proportion of Immigrants from West Indies and unemployment rate among males in the United States with a correlation coefficient (R) of 0.639 and weighted average of 6.7%, a difference of 32.5%.
Male Unemployment Correlation Summary
| Measurement | Greek | Immigrants from West Indies |
| Minimum | 2.7% | 1.3% |
| Maximum | 25.0% | 33.3% |
| Range | 22.3% | 32.0% |
| Mean | 8.5% | 8.8% |
| Median | 6.3% | 6.7% |
| Interquartile 25% (IQ1) | 4.7% | 5.9% |
| Interquartile 75% (IQ3) | 11.3% | 8.4% |
| Interquartile Range (IQR) | 6.6% | 2.5% |
| Standard Deviation (Sample) | 5.4% | 7.7% |
| Standard Deviation (Population) | 5.3% | 7.4% |
Similar Demographics by Male Unemployment
Demographics Similar to Greeks by Male Unemployment
In terms of male unemployment, the demographic groups most similar to Greeks are Immigrants from North America (5.0%, a difference of 0.030%), Assyrian/Chaldean/Syriac (5.0%, a difference of 0.060%), Immigrants from South Africa (5.0%, a difference of 0.080%), New Zealander (5.0%, a difference of 0.16%), and White/Caucasian (5.0%, a difference of 0.18%).
| Demographics | Rating | Rank | Male Unemployment |
| Finns | 97.5 /100 | #66 | Exceptional 5.0% |
| Immigrants | Canada | 97.5 /100 | #67 | Exceptional 5.0% |
| Australians | 97.4 /100 | #68 | Exceptional 5.0% |
| Immigrants | Sweden | 97.4 /100 | #69 | Exceptional 5.0% |
| Whites/Caucasians | 97.3 /100 | #70 | Exceptional 5.0% |
| New Zealanders | 97.3 /100 | #71 | Exceptional 5.0% |
| Immigrants | South Africa | 97.1 /100 | #72 | Exceptional 5.0% |
| Greeks | 97.0 /100 | #73 | Exceptional 5.0% |
| Immigrants | North America | 96.9 /100 | #74 | Exceptional 5.0% |
| Assyrians/Chaldeans/Syriacs | 96.9 /100 | #75 | Exceptional 5.0% |
| Immigrants | Sudan | 96.5 /100 | #76 | Exceptional 5.0% |
| Iranians | 96.4 /100 | #77 | Exceptional 5.0% |
| Immigrants | Northern Europe | 96.4 /100 | #78 | Exceptional 5.0% |
| South Africans | 96.4 /100 | #79 | Exceptional 5.0% |
| Argentineans | 96.2 /100 | #80 | Exceptional 5.0% |
Demographics Similar to Immigrants from West Indies by Male Unemployment
In terms of male unemployment, the demographic groups most similar to Immigrants from West Indies are West Indian (6.7%, a difference of 0.0%), Trinidadian and Tobagonian (6.7%, a difference of 0.32%), Ute (6.6%, a difference of 0.36%), Immigrants from Trinidad and Tobago (6.7%, a difference of 0.52%), and Immigrants from Jamaica (6.7%, a difference of 0.60%).
| Demographics | Rating | Rank | Male Unemployment |
| Immigrants | Haiti | 0.0 /100 | #296 | Tragic 6.5% |
| Chippewa | 0.0 /100 | #297 | Tragic 6.6% |
| Jamaicans | 0.0 /100 | #298 | Tragic 6.6% |
| Immigrants | Bangladesh | 0.0 /100 | #299 | Tragic 6.6% |
| Vietnamese | 0.0 /100 | #300 | Tragic 6.6% |
| Immigrants | Belize | 0.0 /100 | #301 | Tragic 6.6% |
| Ute | 0.0 /100 | #302 | Tragic 6.6% |
| Immigrants | West Indies | 0.0 /100 | #303 | Tragic 6.7% |
| West Indians | 0.0 /100 | #304 | Tragic 6.7% |
| Trinidadians and Tobagonians | 0.0 /100 | #305 | Tragic 6.7% |
| Immigrants | Trinidad and Tobago | 0.0 /100 | #306 | Tragic 6.7% |
| Immigrants | Jamaica | 0.0 /100 | #307 | Tragic 6.7% |
| Aleuts | 0.0 /100 | #308 | Tragic 6.8% |
| Barbadians | 0.0 /100 | #309 | Tragic 6.9% |
| Blacks/African Americans | 0.0 /100 | #310 | Tragic 6.9% |